FIGURE SUMMARY
Title

Smoothened transduces Hedgehog signals via activity-dependent sequestration of PKA catalytic subunits

Authors
Arveseth, C.D., Happ, J.T., Hedeen, D.S., Zhu, J.F., Capener, J.L., Klatt Shaw, D., Deshpande, I., Liang, J., Xu, J., Stubben, S.L., Nelson, I.B., Walker, M.F., Kawakami, K., Inoue, A., Krogan, N.J., Grunwald, D.J., Hüttenhain, R., Manglik, A., Myers, B.R.
Source
Full text @ PLoS Biol.

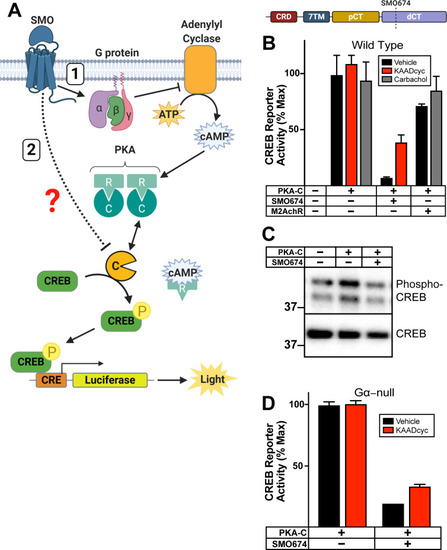
SMO inhibits PKA substrate phosphorylation in a G protein–independent manner.

(A) Schematic of assay to report PKA activity toward soluble substrates. PKA-C phosphorylates CREB which binds CRE, inducing expression of luciferase. SMO can inhibit PKA-C by decreasing cAMP via inhibitory G proteins and AC (route “1”). Alternatively, SMO may inhibit PKA-C via a G protein–independent mechanism (route “2”). (B) Wild-type HEK293 cells were transfected with CRE-luciferase reporter plasmid and GFP (as a negative control) or PKA-C, either alone, with SMO674 (see cartoon above), or with a canonical Gαi/o-coupled GPCR, M2AchR. Transfected cells were treated with the indicated drugs (vehicle control, M2AchR ligand carbachol (3 μM), or SMO inverse agonist KAADcyc (1 μM)). Following drug treatment, cells were lysed and luminescence measured. Note that transfected SMO is constitutively active in HEK293 cells because its inhibitor PTCH1 is present at minimal levels [32,33,41,42], whereas M2AchR requires carbachol for activity. For the sake of clarity, the SMO constructs utilized in each experiment are indicated in the corresponding figure panel. (See S1B Fig for additional information.) (C) Wild-type HEK293 cells were transfected with GFP (as a negative control) or PKA-C, either alone or with SMO674. Lysates were separated via SDS-PAGE and probed with antibodies against phospho-CREB (top) or total CREB (bottom). Molecular masses are in kDa. (D) HEK293 Gα-null cells were transfected with PKA-C, either alone or with SMO674, and treated with vehicle or KAADcyc (1 μM). All CREB reporter data are normalized to 100%, which reflects reporter activation from PKA-C-transfected cells treated with vehicle (n = 3 biological replicates per condition; error bars = SEM). The underlying data for this figure can be found under S1 Data. The uncropped westerns are included in S8 Data. See S1 Table for statistical analysis. AC, adenylyl cyclase; ATP, adenosine triphosphate; cAMP, cyclic AMP; CRE, cyclic AMP response element; CREB, cyclic AMP response element binding protein; dCT, distal segment of the cytoplasmic tail; GPCR, G protein–coupled receptor; KAADcyc, KAAD-cyclopamine; M2AchR, M2 acetylcholine receptor; pCT, proximal segment of the cytoplasmic tail; PKA, protein kinase A; PKA-C, PKA catalytic subunits; SMO, Smoothened.

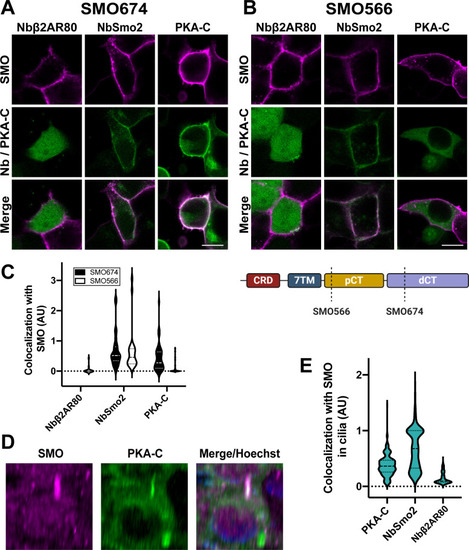
SMO uses its essential pCT domain to recruit PKA-C to the membrane.

HEK293 cells expressing (A) FLAG-tagged SMO674 that contains the pCT or (B) FLAG-tagged SMO566 that lacks the pCT (see cartoon at lower right) were cotransfected with Nbβ2AR80-GFP, NbSmo2-YFP, or PKA-C-YFP. Confocal microscopy images show SMO (magenta) and co-expressed proteins (green). Scale bar = 10 μm. (C) Quantification of colocalization for studies in (A) and (B). (n = 29–121 cells per condition). Note that Nbβ2AR80 displayed a background-subtracted colocalization index of “0” in all SMO674-expressing cells examined. (D) Three-dimensional reconstruction of IMCD3 cells stably coexpressing FLAG-tagged SMO (magenta) with mNeonGreen-tagged PKA-C (green). After treatment with SAG21k to induce SMO accumulation in cilia, live cells were stained with anti-FLAG antibodies (magenta) and Hoechst (blue), then examined via confocal microscopy. See S3 Fig for images from cells expressing FLAG-tagged SMO with mNeonGreen-tagged NbSmo2 or Nbβ2AR80. (E) Quantification of colocalization between SMO and PKA-C, NbSmo2, or Nbβ2AR80 for the experiment described in (D) (n = 197–236 cilia per condition). The underlying data for this figure can be found under S2 Data. dCT, distal segment of the cytoplasmic tail; pCT, proximal segment of the cytoplasmic tail; PKA-C, PKA catalytic subunits; SMO, Smoothened.

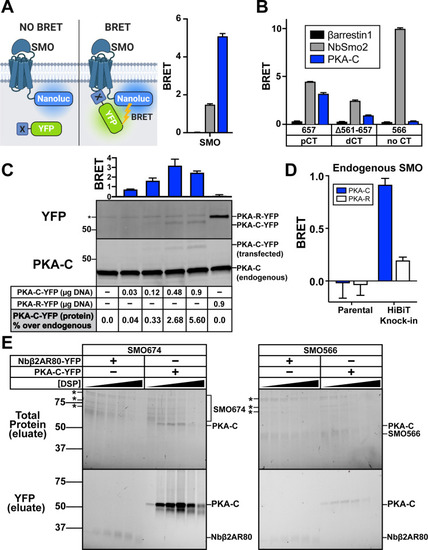
The SMO pCT interacts with PKA-C.

(A) (Left) Schematic showing BRET between a nanoluc-tagged donor (SMO-nanoluc) and a YFP-tagged acceptor. (Right) HEK293 cells were transfected with nanoluc-tagged full-length SMO, along with YFP-tagged βarrestin1 (black), NbSmo2 (gray), or PKA-C (blue) and subject to BRET analysis. (B) HEK293 cells were transfected with nanoluc-tagged SMO657 (which contains the pCT), SMOΔ561–657 (which contains the dCT), or SMO566 (which lacks the CT entirely) as donors, along with the indicated acceptors. Color codes are the same as in (A). Note that NbSmo2 binding does not require the SMO CT (see S2 Fig). In fact, NbSmo2 BRET increases upon SMO CT truncation, likely because the decreased distance between the NbSmo2 binding site and the nanoluc tag leads to more efficient BRET. (C) Top: IMCD3 cells were transfected with nanoluc-tagged full-length SMO along with the indicated amounts of PKA-C-YFP plasmid (in μg) and subject to BRET analysis. PKA-R, which does not bind SMO, serves as a negative control (see Fig 4). Bottom: Following BRET analysis, cell lysates were separated by SDS-PAGE and probed with anti-PKA-C antibodies to detect total (endogenous + YFP-tagged) PKA-C or anti-YFP antibodies to detect YFP-tagged PKA-C (or -R). Blots were quantified via densitometry to estimate the level of PKA-C-YFP expression relative to endogenous PKA-C in each condition. * = cross reactive band. See “Methods” for more information. (D) A clonal IMCD3 cell line in which the endogenous SMO locus was modified to contain a BRET donor (“HiBiT Knock-in”; see S5A–S5C Fig) was transiently transfected with 0.9 μg of YFP-tagged PKA-R or an equivalent amount of PKA-C-YFP, corresponding to a 5% increase in PKA-C compared to endogenous levels (see western blots performed with parental IMCD3 cells in (C)). Cells were then subjected to BRET analysis. Parental (non-modified) IMCD3 cells serve as a negative control. (E) HEK293 cells were infected with viruses encoding FLAG-tagged SMO674 or SMO566 and YFP-tagged PKA-C or Nbβ2AR80 and treated with increasing concentrations of DSP crosslinker (0, 0.125, 0.25, 0.5, 1, or 2 mM). Following DSP quenching, cell lysis, and FLAG purification of SMO complexes, purified samples were separated on reducing SDS-PAGE. Total protein (top) and in-gel YFP fluorescence scans (bottom) for FLAG eluates are shown. * = copurifying contaminant proteins. Molecular masses are in kDa. Recovery of SMO/PKA-C complexes declines at DSP concentrations above 1 mM, likely because high DSP concentrations induce protein aggregation which decreases soluble protein yields in total cell lysates (see S6 Fig). All BRET data are reported as BRET ratios (YFP/nanoluc), and background BRET values derived from cells expressing SMO-nanoluc alone were subtracted from all measurements. (n = 3–6 biological replicates per condition; error bars = SEM). The underlying data for this figure can be found under S3 Data. The uncropped westerns and protein gels are included in S8 Data. See S1 Table for statistical analysis. BRET, bioluminescence resonance energy transfer; dCT, distal segment of the cytoplasmic tail; DSP, dithiobis(succinimidyl propionate); IMCD3, inner medullary collecting duct; pCT, proximal segment of the cytoplasmic tail; PKA-C, PKA catalytic subunits; SMO, Smoothened.

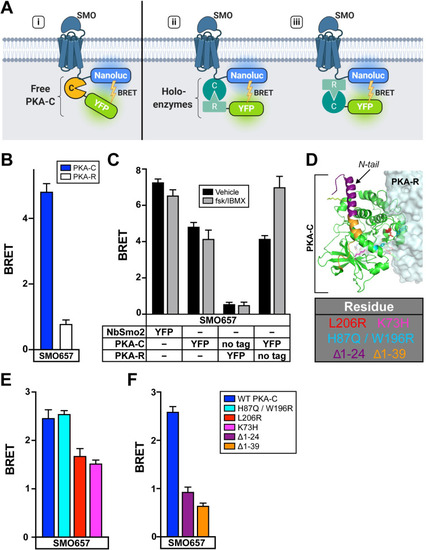
SMO interacts with free PKA-C subunits rather than PKA holoenzymes.

(A) Schematic of BRET assays to test whether SMO interacts with (i) free PKA-C or intact PKA holoenzymes via (ii) PKA-C or (iii) PKA-R subunits. (B) BRET between an SMO657-nanoluc donor and YFP-tagged PKA-C or PKA-R in HEK293 cells. (C) HEK293 cells were transfected with an SMO657-nanoluc donor and untagged or YFP-tagged PKA-C or PKA-R subunits, as described in the table. To stimulate cAMP production, cells were treated for 4 hours with forskolin (10 μM) + the phosphodiesterase inhibitor IBMX (1 mM), which blocks cAMP degradation, prior to BRET measurements. (D) Structure of PKA holoenzyme (PDB: 4X6R). Key PKA-C residues are colored in the structure and indicated in the table (below). (E) BRET between SMO and PKA-C harboring mutations in various regions of the PKA-R binding interface (H87Q/W196R or L206R) or the active site (K73H). (F) BRET between SMO and PKA-C harboring deletions of the first 24, or all 39, amino acids from the N-tail. Data are reported as BRET ratios and background-subtracted as in Fig 3 (n = 3–6 biological replicates per condition; error bars = SEM). The underlying data for this figure can be found under S4 Data. See S1 Table for statistical analysis. BRET, bioluminescence resonance energy transfer; cAMP, cyclic AMP; IBMX, isobutylmethylxanthine; PKA, protein kinase A; PKA-C, PKA catalytic subunits; PKA-R, PKA regulatory subunits; SMO, Smoothened; WT, wild-type.

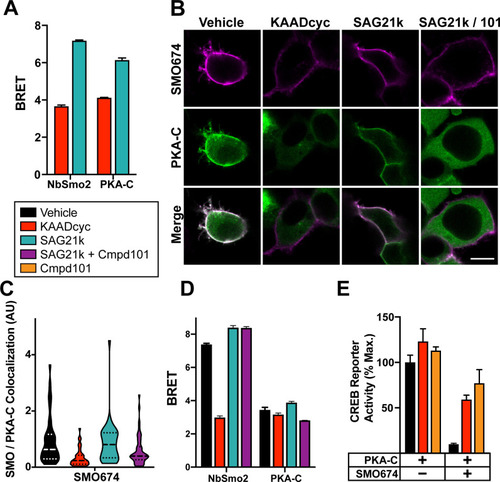
SMO/PKA-C interactions depend on SMO and GRK2/3 activity.

(A) HEK293 cells transfected with SMO657-nanoluc and PKA-C-YFP were treated with SMO inverse agonist KAADcyc (1 μM) or agonist SAG21k (1 μM) for 1 hour prior to BRET measurements. (B) Images of HEK293 cells transfected with FLAG-tagged SMO674 (magenta) and YFP-tagged PKA-C (green) and treated with vehicle, KAADcyc (300 nM), or SAG21k (100 nM) alone or with the GRK2/3 inhibitor Cmpd101 (“101”, 30 μM). Scale bar = 10 μm. (C) Quantification of colocalization between SMO and PKA-C for the experiment in (B) (see “Methods’). (D) HEK293 cells were transfected with SMO657-nanoluc and YFP-tagged versions of either NbSmo2 or PKA-C and treated with vehicle, KAADcyc (1 μM), or SAG21k (1 μM) for 1 hour or with Cmpd101 (30 μM) for 4 hours. (E) Effect of KAADcyc (1 μM) or Cmpd101 (30 μM) on SMO inhibition of the CREB reporter in HEK293 cells. For (E), CREB reporter was normalized to 100%, which reflects reporter activation from PKA-C-transfected cells treated with vehicle. Data in (A), (D), and (E): n = 3–6 biological replicates per condition. Error bars = SEM. Data in (C): n = 119–216 cells per condition pooled from 2 or more independent experiments. The underlying data for this figure can be found under S5 Data. See S1 Table for statistical analysis. BRET, bioluminescence resonance energy transfer; GRK, GPCR kinase; Cmpd101, Compound 101; CREB, cyclic AMP response element binding protein; KAADcyc, KAAD-cyclopamine; PKA-C, PKA catalytic subunits; SMO, Smoothened.

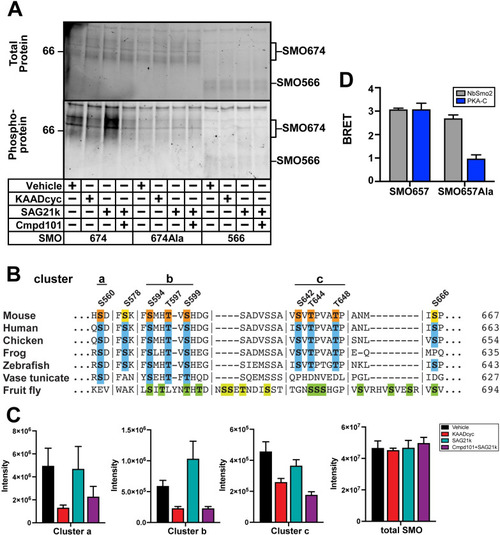
GRK2/3 phosphorylation of conserved SMO pCT residues mediates PKA-C binding.

(A) HEK293 cells expressing GRK2 and either SMO674 (lanes 1–4), SMO674Ala, which carries mutations in 7 GRK2/3 phosphorylation sites (lanes 5–8), or SMO566 (lanes 9–12). Following treatment with SMO modulators or Cmpd101 (4 hours), SMO was isolated via FLAG affinity chromatography, and total protein or phosphoprotein was visualized using Stain-Free imaging or Pro-Q Diamond staining, respectively. Although GRKs often phosphorylate GPCRs on the intracellular loops of their 7TM domains [67,68], we did not observe phosphorylation within this region of SMO via phosphoprotein staining (A) or MS (S10 Fig). Molecular masses are in kDa. (B) Clusters of phosphorylated residues identified by MS are labeled above the sequence of mouse SMO. Orange indicates phosphorylation that depends on SMO and GRK2/3 activity, while yellow indicates non-GRK phosphorylation sites. Alignment with SMO from other species reveals sequence conservation (blue), particularly among vertebrates. Green indicates GRK phosphorylation sites previously mapped in Drosophila Smo [80]. Vertical lines indicate breaks in sequence. See S9A Fig for complete alignment. (C) Targeted MS-based quantification of phosphorylation at each of the 3 activity- and GRK2/3-dependent clusters in the SMO pCT (left 3 graphs) and total SMO protein in each sample (right-most graph). “Intensity” is a measurement of the abundance of phosphorylation sites (left) or total protein (right), derived from model-based estimation in MSstats which combines individual peptide intensities (see “Methods”). (D) BRET between PKA-C and wild-type SMO657 or SMO657Ala. Data in (C): n = 3 biological and 3 technical replicates per condition. Data in (D): n = 3–6 biological replicates per condition. Error bars = SEM. The underlying data for this figure can be found under S6 Data. The uncropped protein gels are included in S8 Data. See S1 Table for statistical analysis. Cmpd101, Compound 101; GPCR, G protein–coupled receptor; GRK, GPCR kinase; KAADcyc, KAAD-cyclopamine; MS, mass spectrometry; pCT, proximal segment of the cytoplasmic tail; PKA-C, PKA catalytic subunits; SMO, Smoothened.

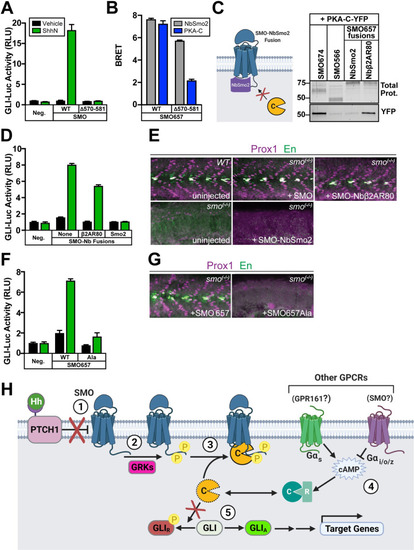
Hh signal transduction is blocked when SMO cannot bind PKA-C.

(A) GLI transcriptional reporter assay in Smo−/− MEFs expressing wild-type SMO or SMOΔ570–581, treated with conditioned medium containing the N-terminal signaling domain of Sonic hedgehog (ShhN, green) or control, non-ShhN-containing conditioned medium (Vehicle, black). GFP serves as a negative control (“Neg.”). (B) BRET in HEK293 cells between nanoluc-tagged wild-type or Δ570–581 forms of SMO657 as donor, with YFP-tagged NbSmo2 (gray) or PKA-C (blue) as acceptor. (C) Left: Schematic of SMO-NbSmo2 fusion, predicted to block interactions with SMO that require the intracellular face of the 7TM domain. Right: YFP-tagged PKA-C was coexpressed in HEK293 cells with FLAG-tagged SMO674 (lane 1), SMO566 (lane 2), SMO657-NbSmo2 (lane 3), or SMO657-Nbβ2AR80 (lane 4). Following cell lysis and FLAG purification of SMO complexes, samples were separated on SDS-PAGE. Fluorescence scans of total protein (top) and YFP (bottom) in FLAG eluates are shown. Note that DSP crosslinker was not used in this experiment; thus, copurification of PKA-C was less efficient than in Fig 3E. Molecular masses are in kDa. (D) GLI transcriptional reporter assay in Smo−/− MEFs expressing fusions to NbSmo2 or Nbβ2AR80. Non-Nb-fused SMO (“None”) serves as a positive control. (E) Confocal images of whole-mount wild-type zebrafish embryos or smo−/− mutants injected with mRNAs encoding either wild-type SMO, SMO-Nbβ2AR80, or SMO-NbSmo2. Embryos 26 hpf were fixed and stained with antibodies against Prox1 (magenta) or En (green) to mark populations of muscle fiber nuclei. (F) GLI transcriptional reporter assay in Smo−/− MEFs expressing wild-type SMO657 (“WT”) or SMO657Ala. (G) Zebrafish were injected with mRNAs encoding wild-type SMO657 or SMO657Ala, then stained for muscle fiber nuclei as described in (E). (H) Proposed model for SMO activation of GLI via PKA-C membrane sequestration: (1) Hh proteins bind to and inhibit PTCH1, inducing an activating conformational change in SMO; (2) Active SMO is recognized and phosphorylated by GRKs; (3) Phosphorylated SMO recruits PKA-C to the membrane, preventing PKA-C from phosphorylating and inhibiting GLI; (4) GPCRs that couple to Gαs (such as GPR161) [92] or Gαi/o/z (perhaps including SMO itself, which can couple to Gαi/o/z [32,33,4042]) can raise or lower cAMP levels, respectively, thereby affecting SMO/PKA-C interactions by regulating the size of the free PKA-C pool. (5) GLI is converted from a repressed (GLIR) to an active (GLIA) form and regulates transcription of Hh target genes. Data in (A), (B), (D), and (F): n = 3 biological replicates per condition. Error bars = SEM. Data in (E) and (G): n = 78 (SMO), 61 (SMO-NbSmo2), 63 (SMO-Nbβ2AR80), 62 (SMO657), 70 (SMO657Ala), and 100 (uninjected). The underlying data for this figure can be found under S7 Data. The uncropped protein gels are included in S8 Data. See S1 Table for statistical analysis. cAMP, cyclic AMP; DSP, dithiobis(succinimidyl propionate); En, Engrailed; GLI, glioma-associated; GPCR, G protein–coupled receptor; Hh, Hedgehog; hpf, hours postfertilization; MEF, mouse embryonic fibroblast; PKA-C, PKA catalytic subunits; RLU, relative luciferase unit; ShhN, N-terminal signaling domain of Sonic hedgehog; SMO, Smoothened.

Acknowledgments
This image is the copyrighted work of the attributed author or publisher, and ZFIN has permission only to display this image to its users. Additional permissions should be obtained from the applicable author or publisher of the image. Full text @ PLoS Biol.