|
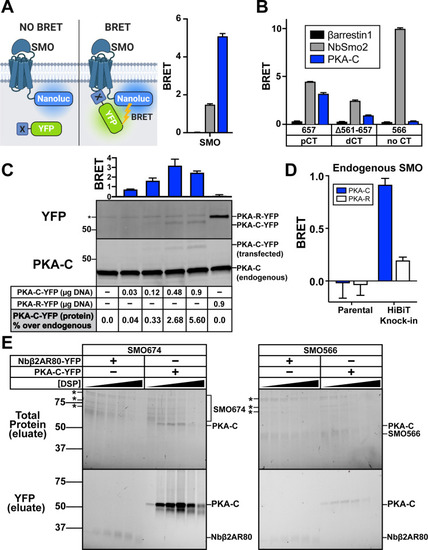
The SMO pCT interacts with PKA-C.(A) (Left) Schematic showing BRET between a nanoluc-tagged donor (SMO-nanoluc) and a YFP-tagged acceptor. (Right) HEK293 cells were transfected with nanoluc-tagged full-length SMO, along with YFP-tagged βarrestin1 (black), NbSmo2 (gray), or PKA-C (blue) and subject to BRET analysis. (B) HEK293 cells were transfected with nanoluc-tagged SMO657 (which contains the pCT), SMOΔ561–657 (which contains the dCT), or SMO566 (which lacks the CT entirely) as donors, along with the indicated acceptors. Color codes are the same as in (A). Note that NbSmo2 binding does not require the SMO CT (see S2 Fig). In fact, NbSmo2 BRET increases upon SMO CT truncation, likely because the decreased distance between the NbSmo2 binding site and the nanoluc tag leads to more efficient BRET. (C) Top: IMCD3 cells were transfected with nanoluc-tagged full-length SMO along with the indicated amounts of PKA-C-YFP plasmid (in μg) and subject to BRET analysis. PKA-R, which does not bind SMO, serves as a negative control (see Fig 4). Bottom: Following BRET analysis, cell lysates were separated by SDS-PAGE and probed with anti-PKA-C antibodies to detect total (endogenous + YFP-tagged) PKA-C or anti-YFP antibodies to detect YFP-tagged PKA-C (or -R). Blots were quantified via densitometry to estimate the level of PKA-C-YFP expression relative to endogenous PKA-C in each condition. * = cross reactive band. See “Methods” for more information. (D) A clonal IMCD3 cell line in which the endogenous SMO locus was modified to contain a BRET donor (“HiBiT Knock-in”; see S5A–S5C Fig) was transiently transfected with 0.9 μg of YFP-tagged PKA-R or an equivalent amount of PKA-C-YFP, corresponding to a 5% increase in PKA-C compared to endogenous levels (see western blots performed with parental IMCD3 cells in (C)). Cells were then subjected to BRET analysis. Parental (non-modified) IMCD3 cells serve as a negative control. (E) HEK293 cells were infected with viruses encoding FLAG-tagged SMO674 or SMO566 and YFP-tagged PKA-C or Nbβ2AR80 and treated with increasing concentrations of DSP crosslinker (0, 0.125, 0.25, 0.5, 1, or 2 mM). Following DSP quenching, cell lysis, and FLAG purification of SMO complexes, purified samples were separated on reducing SDS-PAGE. Total protein (top) and in-gel YFP fluorescence scans (bottom) for FLAG eluates are shown. * = copurifying contaminant proteins. Molecular masses are in kDa. Recovery of SMO/PKA-C complexes declines at DSP concentrations above 1 mM, likely because high DSP concentrations induce protein aggregation which decreases soluble protein yields in total cell lysates (see S6 Fig). All BRET data are reported as BRET ratios (YFP/nanoluc), and background BRET values derived from cells expressing SMO-nanoluc alone were subtracted from all measurements. (n = 3–6 biological replicates per condition; error bars = SEM). The underlying data for this figure can be found under S3 Data. The uncropped westerns and protein gels are included in S8 Data. See S1 Table for statistical analysis. BRET, bioluminescence resonance energy transfer; dCT, distal segment of the cytoplasmic tail; DSP, dithiobis(succinimidyl propionate); IMCD3, inner medullary collecting duct; pCT, proximal segment of the cytoplasmic tail; PKA-C, PKA catalytic subunits; SMO, Smoothened.
|