
- Title
-
Single-cell RNA analysis identifies pre-migratory neural crest cells expressing markers of differentiated derivatives
- Authors
- Lencer, E., Prekeris, R., Artinger, K.B.
- Source
- Full text @ Elife
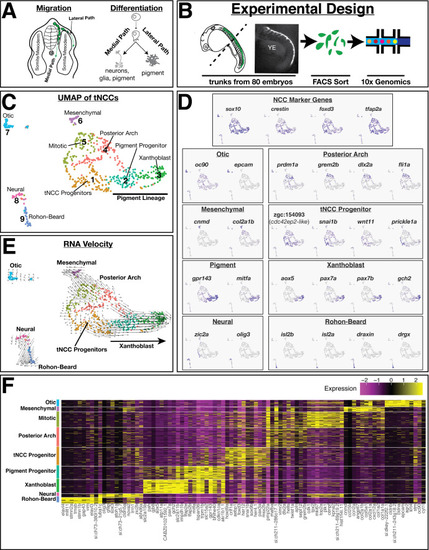
(A) Schematic of zebrafish trunk neural crest cell (tNCC) migration. Medial route migrating tNCCs produce peripheral nervous system and pigment cells, while tNCCs migrating along the dorsal-lateral path produce pigment cells. (B) Schematic of experimental design. NCCs were sampled by dissecting the trunks of 80 sox10:eGFP+ zebrafish at 24 hr post fertilization. GFP+ NCCs were FAC sorted and sequenced using 10X Genomics. Representative image shows sox10:eGFP transgene in a dissected trunk used for cell dissociation. YE: yolk extension. (C) Uniform Manifold Approximation and Projection (UMAP) and clustering of cells reveals multiple transcriptionally unique sox10:eGFP+ cell clusters. Numbers and labels correspond to main text. (D) Expression of select genes in UMAP space shows variable expression across different clusters. (E) RNA velocity connects cells in developmental pseudotime. Direction and length of arrows represent predicted direction of differentiation as calculated by Velocyto (see Materials and methods). Note cells predicted to be differentiating from tNCC progenitor cluster one into xanthoblast cluster 3. (F) Heatmap shows expression of top 10 most differentially expressed genes (log2Fold) for each cluster.
|
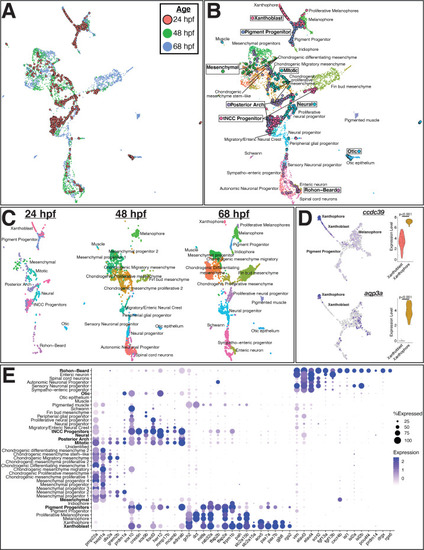
(A) Uniform Manifold Approximation and Projection (UMAP) of integrated datasets showing cells colored by age. (B) UMAP of integrated datasets with cells colored and labeled by annotated category. Annotations of 48 and 68 hpf cells from Howard et al., 2021 are indicated with regular text. Annotations for 24 hpf cells from the current study are boxed and bolded. Points representing cells from 24hpf embryos are larger and outlined in black for visualization. Note that cells group by cell identity across developmental time. (C) Same UMAP as in panel (B) with cells split by age. (D) Representative genes expressed at higher levels in mature xanthophores from 68 hpf embryos than xanthoblasts from 24 hpf embryos. Expression is shown in UMAP space and as violin plots for the 24 hpf xanthoblast and 68 hpf xanthophore cluster cells. p values are from Wilcoxon rank-sum tests. (E) Dotplot of select genes that mark NCCs, pigment progenitors, xanthophores, and Rohon–Beard neurons. Clusters from 24 hpf sox10:eGFP+ cells are bolded. Note that xanthoblasts and xanthophores express the same marker genes. Rohon–Beard neurons express a unique set of genes unlike other neural derivatives from older embryos.
|

(A) Both slc2a15b and gjb8 are predicted to be expressed in pre-migratory xanthoblast cells. (B–G) Quantitative single-molecule in situ hybridization (hybridization chain reaction [HCR]) confirms expression of these genes to aox5 expressing xanthoblasts. (B) Schematic of 24 hr post fertilization (hpf) embryos labeling region of embryos shown in subsequent panels. (C) Quantification of RNA expression (corrected total cell fluorescence [CTCF]) in neural crest cells (NCCs) from sections shows novel marker genes slc2a15b and gjb8 are strongly co-expressed with aox5. Sections were taken every 15 µM and analyses were limited to sections over the yolk extension. Each dot represents a cell (slc2a15b = 3 embryos, 9 slides, 49 cells; gjb8 = 3 embryos, 9 slides, 58 cells). (D–G) Representative whole mount (D, F) and sections (E, G) show expression of slc2a15b (D, E) and gjb8 (F, G) in 24 hpf embryos. DAPI (blue, E, G) labels nuclei. Arrows point to NCCs co-expressing xanthoblast marker genes, while arrowheads point to NCCs that lack expression of these same genes. Note that a number of aox5/slc2a15b/gjb8 NCCs are pre-migratory in the dorsal neural tube (NT). (H) Both fgf13a and cxcr4b are predicted to be expressed in Rohon–Beard neurons (RBs). (I–P) HCR confirms expression of these genes to RBs. (I) Schematic labeling region of trunk shown in subsequent panels. (J) Percent of HNK-1-positive RBs also expressing cxcr4b and fgf13a indicates that these genes are co-expressed in RB cells. The number of HNK-1, cxcr4b, and fgf13a-positive cells in the dorsal NT was counted. Note almost all fgf13a/cxcr4b expressing cells co-localize to HNK-1-positive RB cells. Sample size reported above bars (#cells/#embryos). (K, L) Representative confocal images of whole-mount in situ hybridization for elavl3, fgf13a, and cxcr4b show expression of fgf13a and cxcr4b as two rows of cells in the dorsal NT (arrows). Elavl3 marks the NT, and DAPI (gray) labels nuclei. Note ventral NT expression of cxcr4b (arrowheads in L’). (M, N) Dual immunolabeling for HNK-1 and in situ hybridization for fgf13a (M) or cxcr4b (N) shows gene expression overlaps with HNK-1 labeling in RBs in the dorsal NT (arrows). Arrowheads mark ventral expression of cxcr4b in panel (N). (O, P) While fgf13a and cxcr4b expression was never observed in NCCs, a subset of putative RB cells express the tg(sox10:tagRFP) transgene (gray in panels O and P). Shown are whole-mount 3D projections (O, P) and single slice through z-stack (O’, P’) showing fgf13a/cxcr4b/elavl3-positive cells co-labeled with the sox10 transgene. Note that sox10-positive cells are positioned topologically similar to sox10-negative RB cells. Scale bars for all panels are 20 µM.
|
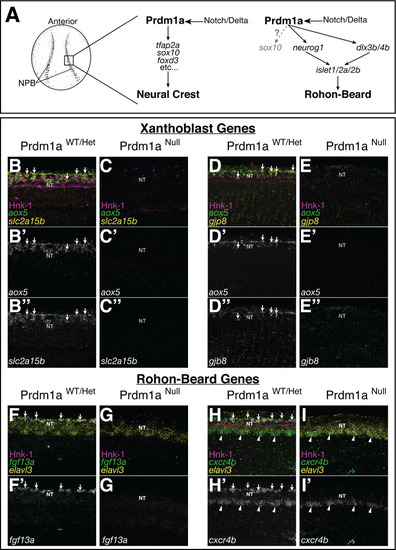
(A) Schematic of neural crest cell (NCC) and RB specification. Both NCCs and RBs are specified in the neural plate border (NPB) of gastrulating embryos. NCC and RB specification share a similar gene regulatory network (GRN) that includes notch/delta and prdm1a expression in the NPB. RBs may transiently express sox10 at low levels (gray). (B–H) Whole-mount confocal images of hybridization chain reaction (HCR) shows expression of xanthoblast (aox5, slc2a15b, gjp8) and RB marker genes (fgf13a, cxcr4b) in wild type (B, D, F, H) and Prdm1a-/- (C, E, G, I) embryos at 24 hr post fertilization (hpf). Hnk-1 staining marks RB cells in all images (note loss of HNK-1 in Prdm1a-/- embryos). Expression of all marker genes is lost from the dorsal neural tube (NT) in Prdm1a-/- embryos that show NCC and RB specification defects. Arrows point to expression of marker genes in dorsal neural tube NCCs (B, D) and RBs (F, H). Expression of genes in regions of the embryo other than the NC and RB is still present. For example, expression of cxcr4b in the ventral neural tube is not altered in the Prdm1a mutant (arrowheads). All images are 3D projections of lateral views of the neural tube taken over the yolk extension of 24 hpf embryos.
|