
|
Figure 2
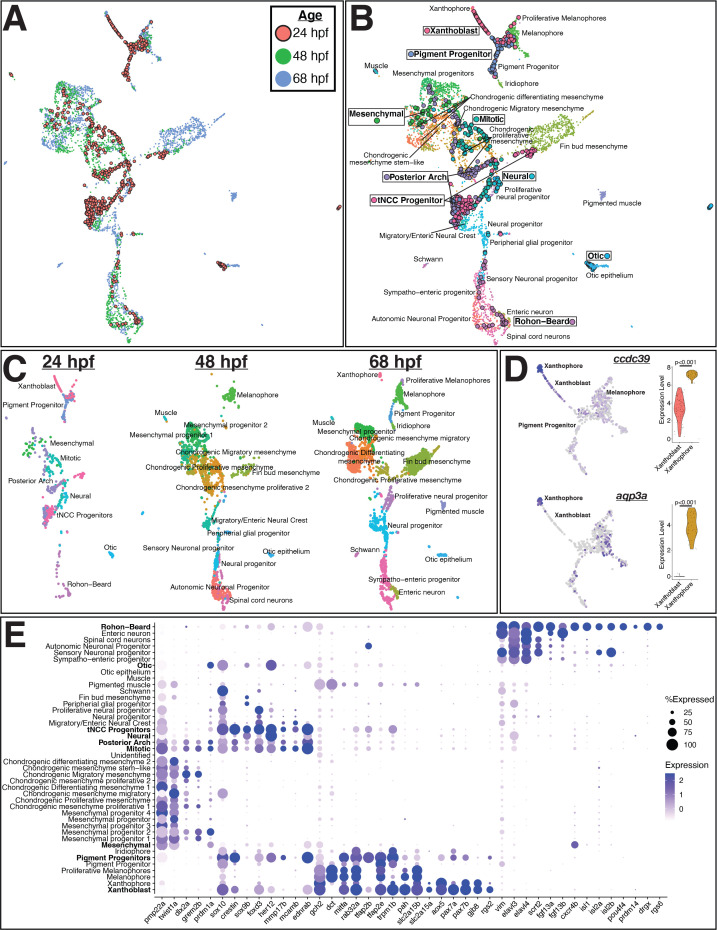
(A) Uniform Manifold Approximation and Projection (UMAP) of integrated datasets showing cells colored by age. (B) UMAP of integrated datasets with cells colored and labeled by annotated category. Annotations of 48 and 68 hpf cells from Howard et al., 2021 are indicated with regular text. Annotations for 24 hpf cells from the current study are boxed and bolded. Points representing cells from 24hpf embryos are larger and outlined in black for visualization. Note that cells group by cell identity across developmental time. (C) Same UMAP as in panel (B) with cells split by age. (D) Representative genes expressed at higher levels in mature xanthophores from 68 hpf embryos than xanthoblasts from 24 hpf embryos. Expression is shown in UMAP space and as violin plots for the 24 hpf xanthoblast and 68 hpf xanthophore cluster cells. p values are from Wilcoxon rank-sum tests. (E) Dotplot of select genes that mark NCCs, pigment progenitors, xanthophores, and Rohon–Beard neurons. Clusters from 24 hpf sox10:eGFP+ cells are bolded. Note that xanthoblasts and xanthophores express the same marker genes. Rohon–Beard neurons express a unique set of genes unlike other neural derivatives from older embryos.
Integrated analysis of sox10:eGFP+ cells from 24, 48, and 68 hr post fertilization (hpf) zebrafish embryos shows pre-migratory trunk neural crest cells (tNCCs) expressing markers of derivative cell types.