
- Title
-
Twisting of the zebrafish heart tube during cardiac looping is a tbx5-dependent and tissue-intrinsic process
- Authors
- Tessadori, F., Tsingos, E., Colizzi, E.S., Kruse, F., van den Brink, S.C., van den Boogaard, M., Christoffels, V.M., Merks, R.M., Bakkers, J.
- Source
- Full text @ Elife
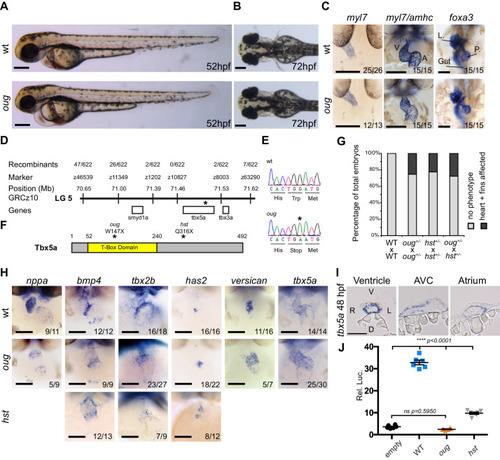
(A) Lateral view of wt and oug mutant embryos at 52 hpf. Note the cardiac edema in oug. (B) At 72 hpf dorsal observation of oug mutant embryos reveals absence of lateral fins. (C) Two dpf oug mutant embryos display defective cardiac looping but normal asymmetric positioning of the internal organs. L, liver; P, pancreas (D) Mapping and genomic position of the oug mutation (indicated by the asterix). (E) A single-nucleotide substitution in tbx5a (G to A) resulting in a tryptophan (Trp; TGG) to stop (TGA) mutation segregates with the oug phenotype. (F) Tbx5a is truncated at amino acid 147 in oug, in its T-Box domain. The hst allele (Q316X; Garrity et al., 2002) is included for comparison (G) Complementation test. Outcross of oug+/- to hst+/- fails to complement the oug cardiac and pectoral fin bud phenotype. (H) Gene patterning is affected in oug hearts at 2dpf. Expression of nppa is reduced in the cardiac chambers while expression of bmp4 and tbx2b is expanded in the AV canal. Cardiac cushion markers has2 and versican also show expanded expression domains. ISH for hst is shown for comparison: while bmp4 and has2 display expanded expression domains as in oug, tbx2b is barely detectable. Transcripts for tbx5a are detected in wt and oug mutants. (I) Transcripts for tbx5a can be detected evenly in transversal sections through the entire 2 dpf heart tube. (J) Luciferase assay establishes that oug retains virtually no activity. Mean values ± SEM are shown. Scale bars (A,B,C,H): 100 µm; (I): 50 µm.
|
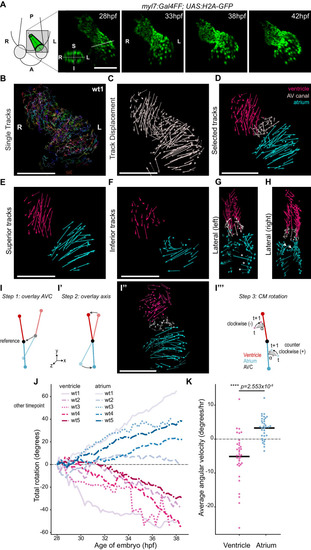
(A) Time-lapse imaging is carried out on tg(myl7:Gal4FF; UAS:H2A-GFP) embryos. In the 28 hpf panel, the dashed line indicates the position of the transversal section shown in the bottom left corner, in which the superior (S), inferior (I), right (R) and left (L) sides of the heart tube are defined. One representative heart is shown. A: anterior; P: posterior. (B) Total tracks (Ventral View). Each track is color-coded and is assigned an ID number. (C) Track displacement vectors for each single trace. (D) Track displacement vectors to be analyzed are selected, categorized by visual inspection and color-labeled accordingly. (E) Cardiac displacement vectors on the superior side of the ventricle and atrium and (F) on the inferior side of the cardiac chambers. (G) Displacement of cardiomyocytes at the outer curvature (asterisks) and (H) at the inner curvature (arrowheads) of the atrium are compatible with rotation of the chamber. (I–I’’') Computational unfolding and angular velocity measurement. (I-I'') Steps 1 and 2 (I, I') taken to computationally unfold the heart tube, resulting in the vector map shown in I''. The angular velocity of the cardiomyocytes is then calculated in the plane perpendicular to the axis (I'''). A detailed description of the methodology is available in the SI (J) Cumulative rotation angle for the ventricle (shades of red) and atrium (shades of blue) in wild-type hearts. Note the opposite direction of rotation of the two chambers. Positive values represent anti-clockwise rotation and negative values represent clockwise rotation with respect to the outflow of the heart. (K) Comparison of the average angular velocity for each replicate per 1.5 hr time window displayed by the chambers analyzed in (J). Horizontal bars: mean values. Scale bars: 100 µm.
|
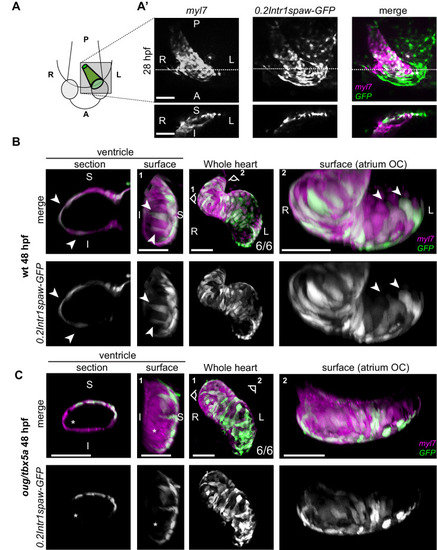
(A) At 28 hpf, as cardiac jogging towards the anterior left side of the embryo is completed, (A’) the tg(0.2Intr1spaw:GFP) labels cardiomyocytes localizing to the superior side of the cardiac tube (section). (B) By 48 hpf cardiac looping morphogenesis is accompanied by displacement in opposite directions of left-originating cardiomyocytes toward the outer curvatures of the ventricle and the atrium (arrowheads in the section and surface view panels). (C) At 48 hpf, the oug mutant heart tube fails to display any constriction at the AV canal and left-originating cardiomyocytes are not visible in the region around the outer curvatures of the cardiac chambers (asterisk; ventricle). Legends: R: Right; L: Left; S: Superior side; I: Inferior side. Scale bars: 50 µm.
|
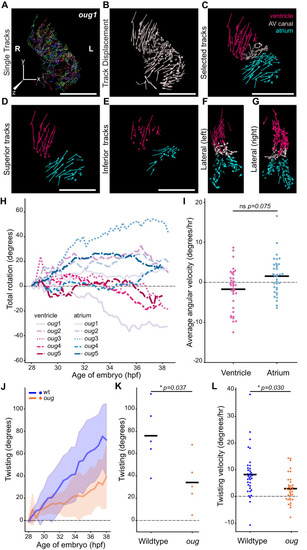
(A) Total tracks (Ventral View) obtained from a time-lapse movie of cardiac looping in an oug mutant. Each track is colour-coded and is assigned an ID number. (B) Track displacement vectors for each trace drawn in (A). (C) Track displacement vectors to be analyzed are selected, categorized by visual inspection and colour-labeled accordingly. (D) Detail of the track displacement vectors on the superior cardiac side and (E) on the inferior cardiac side. (F), (G) Lateral views of the selected tracks reveal no major displacement along the Z-axis. (H) Cumulative rotation angle for the ventricle (shades of red) and atrium (shades of blue) in oug hearts. Compare with Figure 2F; the chambers do not show separation. With the outflow of the heart as viewpoint, positive values represent anti-clockwise rotation and negative values represent clockwise rotation. (I) Comparison of the average angular velocity for each replicate per 1.5 hr time window displayed by the chambers analyzed in (H). Horizontal bars: mean values. (J–L) Twisting of the heart tube during cardiac looping. (J) Plot of the twisting angle (as defined in the main text and in Appendix 1- Supplementary Methods) in time. The looping defect in oug is due to a reduced twisting of the heart tube. Solid lines: Mean; shaded area: standard deviation. (K) Average twisting angle for the sample hearts 9 hr after the start of the timelapse (37 hpf). Horizontal bars: mean values. (L) The twisting velocity in 1.5 hr windows in the wt samples is significantly higher than in oug. Horizontal bars: mean values. Scale bars: (A–C): 100 µm.
|
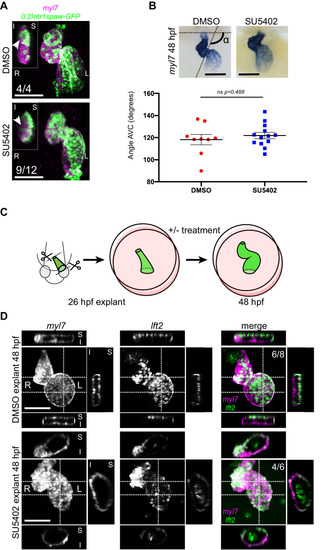
Representative SU5402-treated and DMSO Control (explanted) hearts are shown. (A) 48 hpf tg(myl7:Gal4FF; UAS:RFP; 0.2Intr1spaw-GFP) hearts. In SU5402-treated hearts, dextral looping is completed and left-originating cardiomyocytes (green) can be observed at the ventricle outer curvature, similar to the control condition (arrowheads). (B) Quantification and comparison of AV canal angles in SU5402-treated and DMSO Control embryos. AV canal angle measurement is exemplified in the upper left panel. (C) Heart explant procedure: as cardiac jogging is completed (26 hpf) heart tubes are explanted and put into culture for approximately 24 hpf during which chemical treatments can be carried out. At 48 hpf, the hearts are imaged. (D) Heart tubes explanted at 26 hpf and subsequently cultured in liquid medium for 24 hr display normal formation of a ventricle, atrium and atrioventricular canal. The lft2 reporter allows visualization of left-originating cells at the outer curvature of both ventricle and atrium, in control (DMSO) and treatment (SU5402) conditions. For (B) mean values ± SEM are shown. Legends: R: Right; L: Left; S: Superior side; I: Inferior side. Scale bars: 100 µm.
|
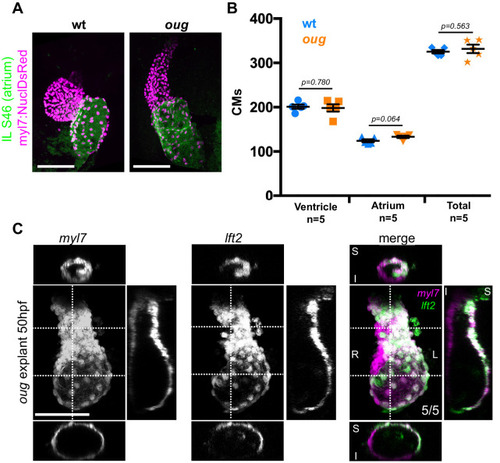
(A) Immunofluorescence with atrium-specific S46 antibody allows distinction of the cardiac chambers. (B) Quantification of ventricular and atrial cardiomyocytes in wt and oug mutant embryos at 2dpf. (C) Explanting oug mutant hearts and culturing them in vitro, ex-embryo does not rescue defective looping. (B): Horizontal bars: mean value ± SEM. Legends: R: Right; L: Left; S: Superior side; I: Inferior side . Scale bars: 100 µm.
|
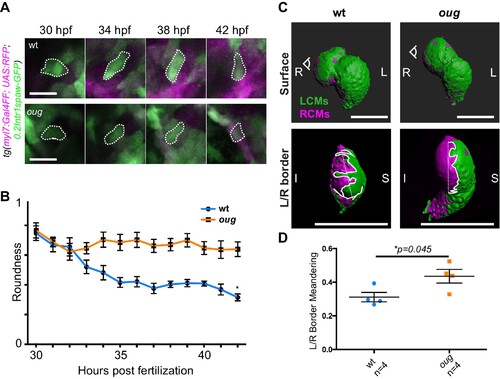
(A) Outline of ventricular cardiomyocytes assessed for assessed for cell roundness. Representative images of the data quantified in (B) are shown for wt (upper row) and oug (lower row). (B) Quantification of cell roundness as observed in (A) and comparison between values for wt and oug mutants. (C) Upper panels: surface rendering of tg(myl7:Gal4FF; UAS:RFP; 0.2Intr1spaw-GFP) in 48 hpf hearts allows clear definition of a boundary between Left-originating cardiomyocytes (LCMs, green) and right-originating cardiomyocytes (RCMs, magenta). This allows calculation of the straightness index of the left/right boundary (white) of the ventricle (lower panels, respective viewpoint indicated in upper panels). The straightness index is calculated as the ratio between distance between start and end point of left/right boundary at (straight dotted line) and length of left/right boundary measured on the ventricular surface. (D) Quantification of the straightness index is indicative of the level of anisotropic growth in wt and oug mutant hearts. (B) and (D): Horizontal bars: mean value ± SEM. Legends: R: Right; L: Left; S; Superior side; I: Inferior side. Scale bars: (A) 20 µm; (C) 100 µm. (A) Outline of ventricular cardiomyocytes assessed for assessed for cell roundness. Representative images of the data quantified in (B) are shown for wt (upper row) and oug (lower row). (B) Quantification of cell roundness as observed in (A) and comparison between values for wt and oug mutants. (C) Upper panels: surface rendering of tg(myl7:Gal4FF; UAS:RFP; 0.2Intr1spaw-GFP) in 48 hpf hearts allows clear definition of a boundary between Left-originating cardiomyocytes (LCMs, green) and right-originating cardiomyocytes (RCMs, magenta). This allows calculation of the straightness index of the left/right boundary (white) of the ventricle (lower panels, respective viewpoint indicated in upper panels). The straightness index is calculated as the ratio between distance between start and end point of left/right boundary at (straight dotted line) and length of left/right boundary measured on the ventricular surface. (D) Quantification of the straightness index is indicative of the level of anisotropic growth in wt and oug mutant hearts. (B) and (D): Horizontal bars: mean value ± SEM. Legends: R: Right; L: Left; S; Superior side; I: Inferior side. Scale bars: (A) 20 µm; (C) 100 µm. (A) Outline of ventricular cardiomyocytes assessed for assessed for cell roundness. Representative images of the data quantified in (B) are shown for wt (upper row) and oug (lower row). (B) Quantification of cell roundness as observed in (A) and comparison between values for wt and oug mutants. (C) Upper panels: surface rendering of tg(myl7:Gal4FF; UAS:RFP; 0.2Intr1spaw-GFP) in 48 hpf hearts allows clear definition of a boundary between Left-originating cardiomyocytes (LCMs, green) and right-originating cardiomyocytes (RCMs, magenta). This allows calculation of the straightness index of the left/right boundary (white) of the ventricle (lower panels, respective viewpoint indicated in upper panels). The straightness index is calculated as the ratio between distance between start and end point of left/right boundary at (straight dotted line) and length of left/right boundary measured on the ventricular surface. (D) Quantification of the straightness index is indicative of the level of anisotropic growth in wt and oug mutant hearts. (B) and (D): Horizontal bars: mean value ± SEM. Legends: R: Right; L: Left; S; Superior side; I: Inferior side. Scale bars: (A) 20 µm; (C) 100 µm.
|
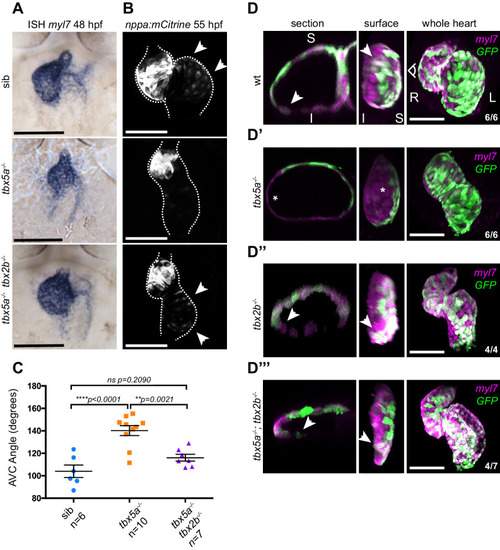
(A) ISH for myl7 at 50 hpf in wild type siblings, oug mutants and tbx5a;tbx2b double mutants. (B) Confocal maximum projections of 2dpf tg(nppa:mCitrine) hearts. In the tbx5a;tbx2b double mutants, atrial expression of nppa, which was lost in oug mutants, is re-instated. (C) Quantification and comparison of AV canal angles in wild-type siblings, tbx5a mutants and tbx5a;tbx2b double mutants. Quantification of AV canal angle is carried out as reported in Figure 5D. (D–D’’’) 48 hpf tg(myl7:Gal4FF; UAS:RFP; 0.2Intr1spaw-GFP) hearts. Wt (D) and tbx5-/- (D’) are shown for comparison. tbx2b-/- hearts (D’’) display robust dextral looping and left-originating cardiomyocytes (green) at the ventricle outer curvature, similar to wt (arrowheads in D; Figure 3B). In double homozygous mutants tbx5a-/-; tbx2b-/- (D’’’) rescue of cardiac looping is observed, accompanied by presence of left-originating cardiomyocytes at the ventricle OC (Compare with D, D’’). (C): Horizontal bars: mean value ± SEM. Legends: R: Right; L: Left; S: Superior side; I: Inferior side. Scale bars: 100 µm.
|
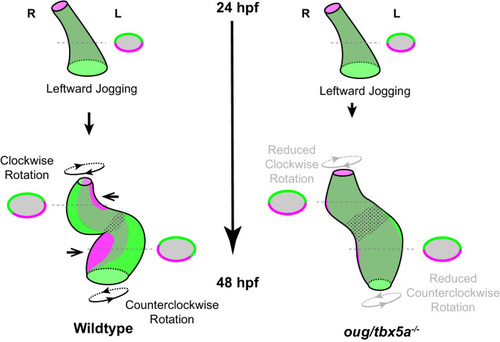
Viewpoint for describing direction of rotation is always the outflow tract (OFT). Left- and right- originating regions of the embryonic myocardium are reported in green and magenta, respectively. Transversal sections are shown next to the corresponding cartoon. In wild-type hearts, at the end of cardiac jogging, twisting of the heart tube results in disposition of left-originating cardiomyocytes toward the outer curvatures of both the ventricle and atrium. The resulting twisting of the heart tube is driven by the clockwise rotation of the ventricle and counterclockwise rotation of the atrium, around a fixed hinge, the AV canal. In |