
- Title
-
Evaluation of the Antidiabetic Potential of Extracts of Urtica dioica, Apium graveolens, and Zingiber officinale in Mice, Zebrafish, and Pancreatic β-Cell
- Authors
- Pérez Gutiérrez, R.M., Muñiz-Ramirez, A., Garcia-Campoy, A.H., Mota Flores, J.M.
- Source
- Full text @ Plants (Basel)

ZFIN is incorporating published figure images and captions as part of an ongoing project. Figures from some publications have not yet been curated, or are not available for display because of copyright restrictions. PHENOTYPE:
|
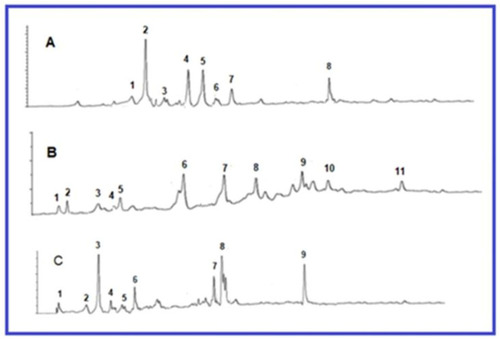
Figure 1. HPLC chromatogram of (A) U. dioica: isorhamnetin-3-O-rutinoside (1); quercetin-3-o-glucoside (2); kaempferol-3-O-glucoside or astragalin (3); myrecetin (4); naringin (5); rutin (6); ferulic acid (7); ellagic acid (8); (B) Z. officinale: morin (1); gallic acid (2); fisetin (3); vanillic acid (4); epicatechin (5); trans-cinnamic acid (6); kaempferol (7); naringenin (8); rutin (9); ferulic acid (10); quercetin (11); (C) A. graveolens chlorogenic acid (1); vanillic acid (2); caffeic acid (3); syringic acid (4); luteolin (5); p-coumaric acid (6); rutin (7); ferulic acid (8); quercetin (9).
|

Figure 2. Values are shown as mean ± SD (n = 8). (A) Insulin plasma; (B) Insulin resistance (HOMA-IR); (C) HbA1c over 4 weeks of treatment (250 mg/kg). The animals were fasted 12 h before blood sampling. Metformin (Mtf; 100 mg) was administered as a positive control, and the vehicle was administered as negative control. There is a significant difference compared with the control group * p < 0.01 and compared vs. diabetic control group ** p < 0.05.
|

Figure 3. Effects of UZA, U, A, and Z treatment on marker in liver (A) ASTL; (B) ALT; (C) ALT; (D) TBARS levels; Data are presented as the means ± SD (n = 6). ** p < 0.001, * p < 0.05.
|
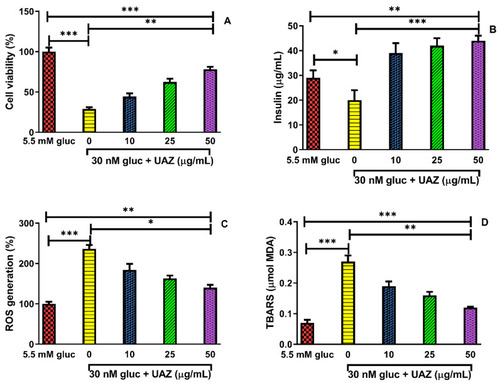
Figure 4. (A) UAZ enhance pancreatic b-cell viability when RINm5F cells were incubated in RPMI1640 medium containing glucose at 30 mM with or without various concentrations of (UAZ; 10, 25, and 50 µg/mL) for 48 h; (B) UAZ improved high glucose impaired insulin secretion; (C) Effect of UAZ on intracellular levels of reactive oxygen species (ROS) in high glucose-treated RINm5F cells; (D) TBARS generation in high glucose-treated INS-1 pancreaticβ-cells. The use of 5.5 mM glucose was representative of normal glucose conditions and the 30 mM glucose treatments represent high glucose conditions. Data are expressed as the mean ± SD, * p < 0.05, ** p < 0.01, and *** p < 0.001.
|