
- Title
-
Crosstalks between NOD1 and Histone H2A Contribute to Host Defense against Streptococcus agalactiae Infection in Zebrafish
- Authors
- Wu, X., Xiong, F., Fang, H., Zhang, J., Chang, M.
- Source
- Full text @ Antibiotics (Basel)
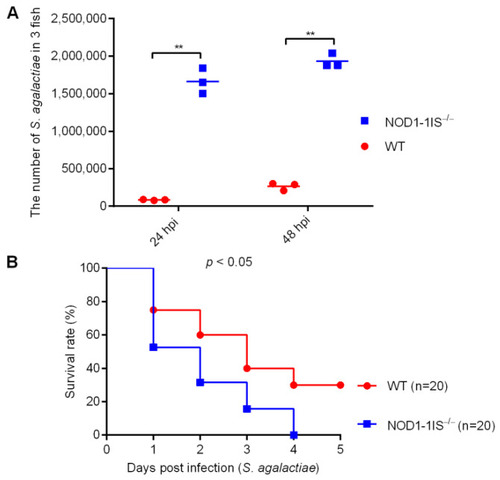
The effect of zebrafish NOD1 in Streptococcus agalactiae infection. (A) Effect of NOD1 knockdown on the proliferation of S. agalactiae in the mixture of liver and spleen from zebrafish at the age of 7 months. **, p < 0.01. (B) NOD1−/− zebrafish were more sensitive to S. agalactiae infection compared with the WT based on the survival rate. |
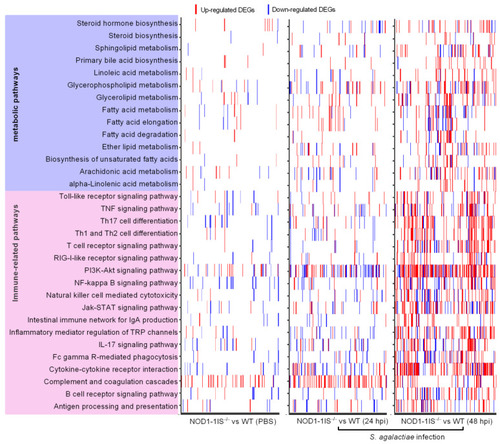
Heatmap presenting DEG profiles of each of the enriched immune-related and lipid metabolism pathways. The horizontal axis represents DEGs, and the vertical axis represents the enriched pathways. The existence of up-regulated DEG in a pathway is highlighted in red and down-regulated DEG is blue. |
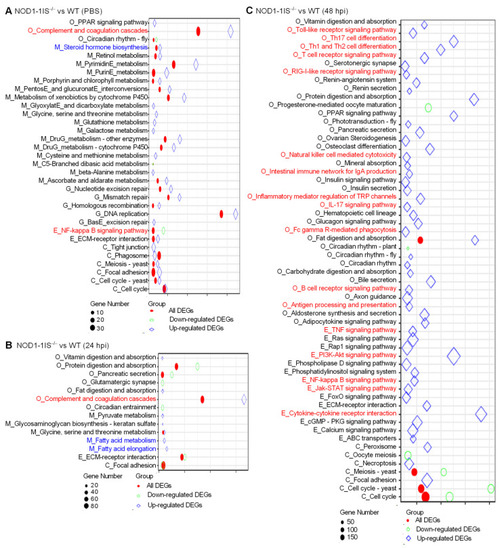
KEGG enrichment analysis. (A) The KEGG enrichment analysis for DEGs between WT and NOD1-deficiency zebrafish injected with the control PBS. (B) The KEGG enrichment analysis for DEGs between WT and NOD1-deficiency zebrafish infected with S. agalactiae for 24 h. (C) The KEGG enrichment analysis for DEGs between WT and NOD1-deficiency zebrafish infected with S. agalactiae for 48 h. All of the KEGG pathways shown in the figure are significantly enriched (Q-value < 0.05). The x-axis represents the rich factor, and the y-axis indicates the corresponding KEGG pathway. The immune-related pathways are red and the lipid-related pathways are blue. The color and shape of the point indicates the type of DEGs. The size of the point indicates the gene numbers. |
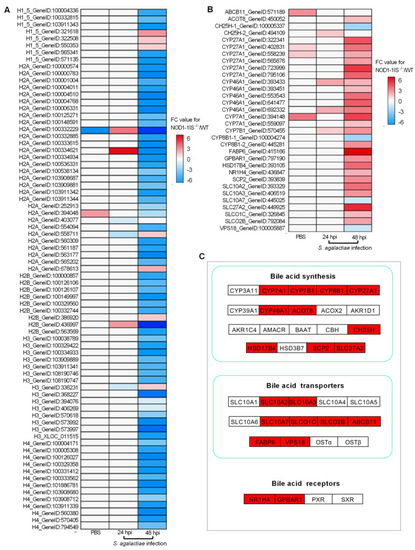
The effect of NOD1 deficiency on the transcriptional regulation of histones and many of the genes involved in bile acid metabolism. (A) Heatmap of differently expressed histones. (B) Heatmap of bile acid-related DEGs. (C) The expression trends of bile acid-related genes involved in bile acid synthesis, bile acid transporters, and bile acid receptors. The genes in red background were found to be differently expressed in the present study. |
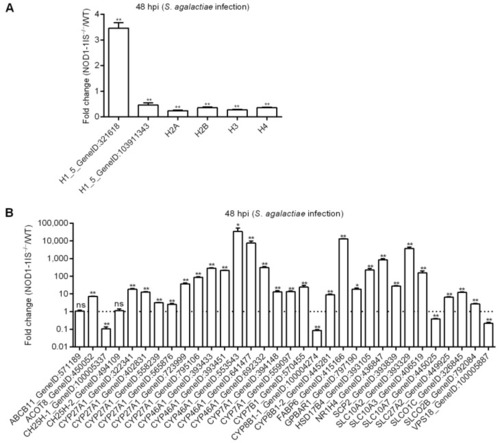
Figure 5 Validation of differential expression by qRT-PCR. (A) The expressions of candidate DEGs for histone variants confirmed by qRT-PCR. (B) The expressions of candidate DEGs for bile acid metabolism-related genes confirmed by qRT-PCR. Data represent the means ± the SEM and are tested for statistical significance using two-tailed student’s t-test. *, p < 0.05; **, p < 0.01; ns, not significant. |
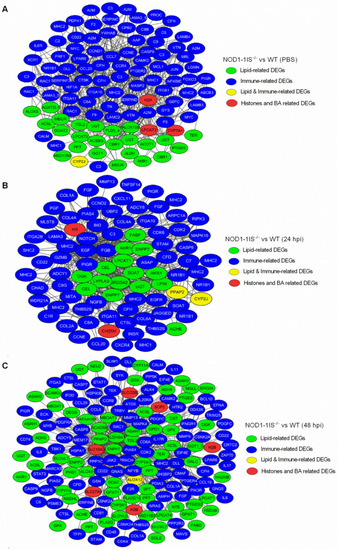
Co-occurrence network relationship among immune-related and metabolism-related DEGs via WGCNA analysis. (A) Co-occurrence network relationship among immune-related and metabolism-related DEGs in the NOD1-1IS−/− vs. WT groups injected with PBS. (B) Co-occurrence network relationship among immune-related and metabolism-related DEGs in NOD1-1IS−/− vs. WT group infected with S. agalactiae for 24 h. (C) Co-occurrence network relationship among immune-related and metabolism-related DEGs in the NOD1-1IS−/− vs. WT groups infected with S. agalactiae for 48 h. The node color indicates the biological function of each node. |
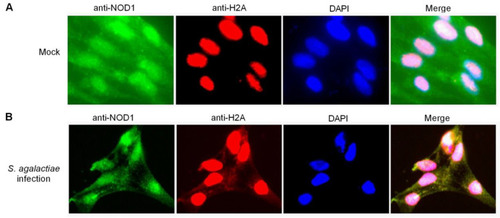
The colocalization between NOD1 and histone H2A in ZF4 cells. (A) The colocalization between NOD1 and histone H2A in mock-infected ZF4 cells. (B) The colocalization between NOD1 and histone H2A in the ZF4 cells infected with S. agalactiae. |
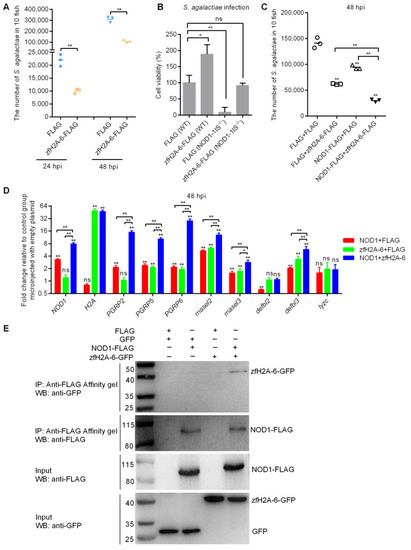
The effects of NOD1 and zfH2A-6 in the defense against S. agalactiae infection. (A) The effect of zfH2A-6 overexpression in the zebrafish larvae on the proliferation of S. agalactiae. (B) The effect of zfH2A-6 on the cell survival in WT and NOD1-deficient cells with S. agalactiae infection. (C) The effect of NOD1 on the antibacterial effect against S. agalactiae infection with or without the existence of zfH2A-6. (D) The transcription regulation of NOD1 on the antibacterial genes in the case of S. agalactiae infection with or without the existence of zfH2A-6. Data are expressed as mean ± SEM of three independent experiments. * p < 0.05; ** p < 0.01; ns—not significant. The asterisk above the error bars indicate statistical significance using the group transfected with empty plasmid as the control group. The asterisk above the bracket indicate statistical significance between the two groups connected by the bracket. (E) NOD1 interacts with zfH2A-6. The interaction between FLAG and GFP or zfH2A-6 is used as the negative controls. |