
FIGURE
Figure 2
- ID
- ZDB-FIG-210810-49
- Publication
- Wu et al., 2021 - Crosstalks between NOD1 and Histone H2A Contribute to Host Defense against Streptococcus agalactiae Infection in Zebrafish
- Other Figures
- All Figure Page
- Back to All Figure Page
Figure 2
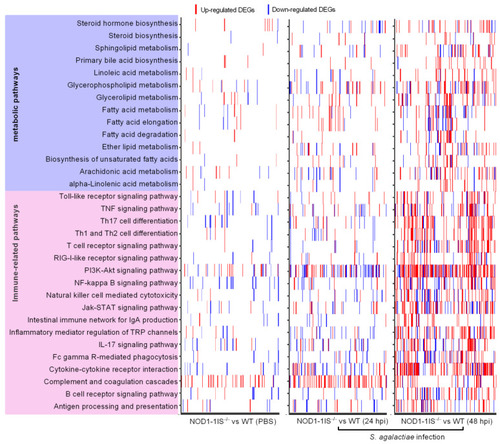
Heatmap presenting DEG profiles of each of the enriched immune-related and lipid metabolism pathways. The horizontal axis represents DEGs, and the vertical axis represents the enriched pathways. The existence of up-regulated DEG in a pathway is highlighted in red and down-regulated DEG is blue. |
Expression Data
Expression Detail
Antibody Labeling
Phenotype Data
Phenotype Detail
Acknowledgments
This image is the copyrighted work of the attributed author or publisher, and
ZFIN has permission only to display this image to its users.
Additional permissions should be obtained from the applicable author or publisher of the image.
Full text @ Antibiotics (Basel)