
|
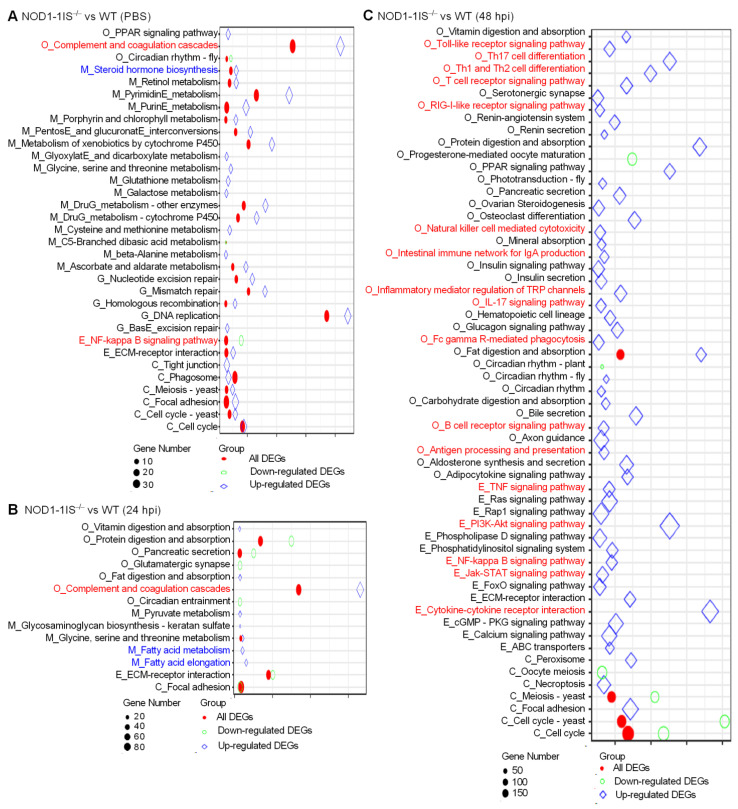
Figure 3 KEGG enrichment analysis. (A) The KEGG enrichment analysis for DEGs between WT and NOD1-deficiency zebrafish injected with the control PBS. (B) The KEGG enrichment analysis for DEGs between WT and NOD1-deficiency zebrafish infected with S. agalactiae for 24 h. (C) The KEGG enrichment analysis for DEGs between WT and NOD1-deficiency zebrafish infected with S. agalactiae for 48 h. All of the KEGG pathways shown in the figure are significantly enriched (Q-value < 0.05). The x-axis represents the rich factor, and the y-axis indicates the corresponding KEGG pathway. The immune-related pathways are red and the lipid-related pathways are blue. The color and shape of the point indicates the type of DEGs. The size of the point indicates the gene numbers.