
- Title
-
A BMP4-p38 MAPK signaling axis controls ISL1 protein stability and activity during cardiogenesis
- Authors
- Jing, Y., Ren, Y., Witzel, H.R., Dobreva, G.
- Source
- Full text @ Stem Cell Reports
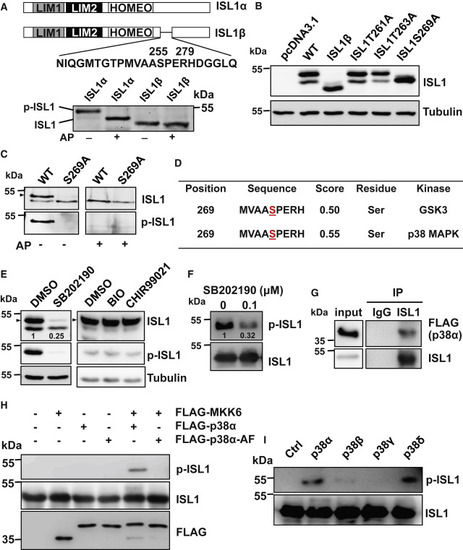
Figure 1. ISL1 is phosphorylated by p38 on serine 269 (A) Schematic representation of ISL1α and ISL1β (top panel). Alkaline phosphatase (AP) treatment of extracts from cells expressing either ISL1α or ISL1β, showing that the β form is not phosphorylated. (B) Western blot (WB) analysis of extracts of cells expressing ISL1α harboring different mutations in the serine or threonine residues within the 256–278 region. Tubulin served as loading control. (C) AP treatment of extracts from cells expressing either WT ISL1α or ISL1αS269A, showing that ISL1αS269A mutant is not phosphorylated. Antibody raised against synthetic ISL1 phospho-S269-peptide detected phosphorylated ISL1 only in extracts overexpressing ISL1 but not the S269A mutant. Arrowheads in this and the following figure panels indicate phosphorylated ISL1. (D) Results of predictions of kinase-specific protein phosphorylation sites using NetPhosK1.0. The potentially modified residues are underlined. (E) WB analysis of ISL1 overexpressing HEK293T cells treated either with DMSO, 50 μM p38 inhibitor SB202190, or with the GSK3 inhibitors, 2.5 μM BIO and 5 μM CHIR-99021 for 16 h using ISL1 and phospho-ISL1 antibody. (F) In vitro kinase assay using recombinant ISL1 incubated with total protein extracts from cells treated with or without SB202190. (G) Co-immunoprecipitation of protein extracts of HEK293T cells overexpressing ISL1 and FLAG-p38α using ISL1 antibody followed by WB analysis with FLAG and ISL1 antibody. (H) In vitro kinase assay with recombinant ISL1 incubated with combinations of immunopurified MKK6, p38α, and kinase-deficient p38α (p38α-AF) proteins. FLAG-tagged constructs for these kinases were overexpressed alone or in combinations and immunoprecipitated using FLAG antibody. (I) In vitro kinase assay with recombinant ISL1 incubated with immunopurified MKK6 together with different p38 MAPK isoforms. |
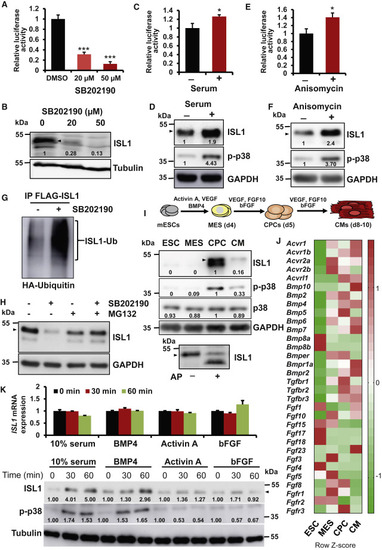
Figure 2. ISL1 phosphorylation by the BMP4-p38 MAPK signaling axis affects its protein stability (A and B) Luciferase assay of NIH3T3 cells expressing Isl1 and a Mef2c anterior heart field (AHF) enhancer reporter construct (pGL4-Mef2cPromoter-Luc2-AHF), treated either with DMSO or the p38 inhibitor SB202190 (n = 3) (A) and WB analysis for ISL1 of protein extracts used in the reporter assays (B). (C–F) Luciferase assay of NIH3T3 cells stably expressing Isl1 transfected with the Mef2c reporter construct and treated with or without 10% fetal bovine serum for 1 h (n = 3) (C) or with or without 0.01 μM anisomycin for 1 h (n = 3) (E), and WB analysis for ISL1 of protein extracts used in the reporter assays (D, F). (G) HA-tagged ubiquitin and FLAG-tagged ISL1 were transiently expressed in HEK293T cells. Cells were either treated with DMSO or SB202190 together with MG132 for 6 h before harvesting. Equivalent amounts of total protein were immunoprecipitated with anti-FLAG (M2) antibody and detected with an anti-HA antibody. (H) WB analysis for ISL1 of protein extracts of ISL1 overexpressing NIH3T3 cells treated with DMSO or SB202190 with or without the proteasome inhibitor MG132 for 16 h. (I) Scheme depicting the distinct stages of directed cardiac differentiation (top). MES, mesoderm; CPCs, cardiac progenitor cells; CMs, cardiomyocytes. WB analysis for ISL1 and activated phospho-p38 at different stages of directed differentiation of mESCs into CMs (middle). AP treatment of extracts from CPCs (bottom), showing that ISL1 is exclusively phosphorylated. (J) Heatmap representation of expression data for genes involved in BMP, activin, and FGF signaling during the course of cardiac differentiation (Wamstad et al., 2012). (K) Isl1 mRNA expression in mESCs overexpressing CMV-driven Isl1 treated with BMP4, basic FGF (bFGF), or activin for 30 or 60 min (top panel). WB analysis for ISL1 and activated phospho-p38 MAPK of protein extracts from Isl1−/− mESCs overexpressing CMV-driven Isl1 treated with BMP4, bFGF, or activin for 30 or 60 min (bottom panel). |
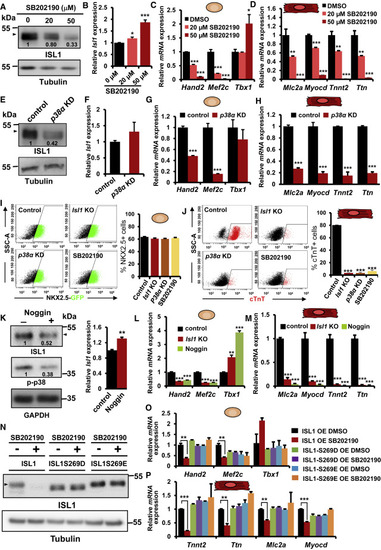
Figure 3. p38 regulates ISL1 stability and function during cardiac differentiation (A and B) WB analysis of protein extracts (A) and Isl1 qPCR analysis (n = 4) (B) of mESC-derived CPCs treated at the MES stage (d4) with different concentrations of SB202190 for 24 h. (C) Relative mRNA expression of Tbx1 and ISL1 downstream targets (Hand2 and Mef2c) in CPCs (d5) treated at the MES stage with different concentrations of SB202190 for 24 h (n = 4). (D) Relative mRNA expression of CM marker genes in CMs (d8) differentiated from cells treated at the cardiac mesoderm stage with different concentrations of SB202190 for 96 h (n = 4). (E and F) WB analysis of protein extracts (E) and Isl1 qPCR analysis (n = 4) (F) of CPCs (d5) derived from mESCs stably overexpressing control small hairpin RNA (shRNA) or shRNA against p38α. (G and H) Relative mRNA expression of Tbx1, Hand2, and Mef2c in CPCs (d5, n = 4) (G) and of CM marker genes in CMs (d8, n = 4) (H), differentiated from control and p38α knockdown mESCs. (I) Representative FACS analyses of NKX2.5 + CPCs differentiated from Isl1−/− and p38α knockdown mESCs or mESCs treated with p38 inhibitor at the MES stage for 24 h (left). Percentage of NKX2.5+ CPCs at d5 determined by FACS analysis (n = 3) (right). (J) Representative FACS analyses of cTnT+ CMs at d10 of ESC differentiation (left) and percentage of cTnT+ CMs at d10 determined by FACS analysis (n = 3) (right). (K) WB analysis of protein extracts (left) and Isl1 qPCR analysis (right) of Isl1−/− CPCs overexpressing CMV-driven Isl1 treated with Noggin at the MES stage for 24 h. (L and M) Relative mRNA expression of Tbx1, Hand2, and Mef2c in CPCs (d5, n = 4) (L) and of CM marker genes in CMs (d8, n = 4) (M), differentiated from cells treated with Noggin from the MES stage. (N) WB analysis of protein extracts from CPCs derived from Isl1−/− mESCs overexpressing EF1α-driven Isl1 or Isl1 carrying phosphomimetic mutations of serine 269 (ISL1S269D, ISL1S269E) treated either with DMSO or SB202190 at the MES stage for 24 h. (O and P) Relative mRNA expression of Tbx1, Hand2, and Mef2c in CPCs (d5, n = 4) (O) and of CM marker genes in CMs (d8, n = 4) (P), differentiated from Isl1−/− mESCs overexpressing ISL1, ISL1S269E, or ISL1S269D treated either with DMSO or SB202190 from the MES stage. |

Figure 4. Inhibition of p38 results in ISL1 degradation in vivo and in defects in cardiac morphogenesis and function (A) In situ hybridization of zebrafish embryos at the ten somite stage for isl1, mef2ca, mef2cb, and nkx2.5 expression. The embryos were treated either with DMSO or SB202190 starting from the three somite stage. Scale bar, 0.2 mm. (B) WB analysis of ISL1/2 in 72 hpf zebrafish embryos treated either with DMSO or p38 inhibitor at 24 hpf (at least 20 embryos per sample). (C) Heart beats per minute at 48 and 72 hpf of zebrafish embryos treated either with DMSO or p38 inhibitor at 24 hpf. Error bars represent SEM of four clutches. The numbers of embryos used per condition are indicated in Figure S3F. (D) Representative confocal images of control and p38 inhibitor-treated Tg(myl7:EGFP-HsHRAS)s883 embryos at 72 hpf. Scale bar, 50 μm. (E) Quantification of ventricular CM numbers at 48 and 72 hpf of zebrafish embryos treated either with DMSO or p38 inhibitor at 24 hpf. DMSO, n = 15; 50 μM SB202190, n = 15, from 3 clutches. (F) Representative in situ hybridization for ltbp3 (top) or bmp4 (bottom) of zebrafish embryos at 48 hpf treated either with DMSO or p38 inhibitor at 24 hpf as well as of isl2b−/− or isl1−/− embryos. The arrow points to the bmp4 expression at the venous pole lost upon p38 inhibitor treatment and in isl1−/− embryos. Scale bar, 0.1 mm. (G) WB analysis for ISL1 of protein extracts from E8.5 mouse embryos treated either with DMSO or 50 μM SB202190 for 24 h in a whole-embryo ex vivo culture (at least five embryos per sample). (H) Relative Isl1 mRNA expression in ex-vivo-cultured mouse embryos treated either with DMSO or 50 μM SB202190. (I) Representative right lateral views of the hearts of embryos treated either with DMSO (n = 27) or 20 μM (n = 9) and 50 μM SB202190 (n = 26) at E8.5 for 24 h. Scale bar, 0.2 mm. (J) Heart beats per minute of ex-vivo-cultured mouse embryos treated either with DMSO or SB202190 (n = 8). (K) Relative mRNA expression of SAN lineage markers Hcn4 and Shox2 in ex-vivo-cultured mouse embryos treated either with DMSO or 20 and 50 μM SB202190 starting at E8.5 for 24 h (n = 6). (L) Model of the role of BMP-p38 MAPK signaling axis in ISL1-driven cardiogenesis. In WT CPCs, BMP signaling activates p38 leading to ISL1 phosphorylation at S269 thereby preventing ISL1 degradation and ensuring its transcriptional activity during cardiogenesis. Interfering with the BMP-p38 MAPK signaling axis leads to degradation of ISL1 by the proteasome, resulting in defects in CM differentiation and impaired SHF development. |