
Fig. 3
- ID
- ZDB-FIG-220928-9
- Publication
- Jing et al., 2021 - A BMP4-p38 MAPK signaling axis controls ISL1 protein stability and activity during cardiogenesis
- Other Figures
- All Figure Page
- Back to All Figure Page
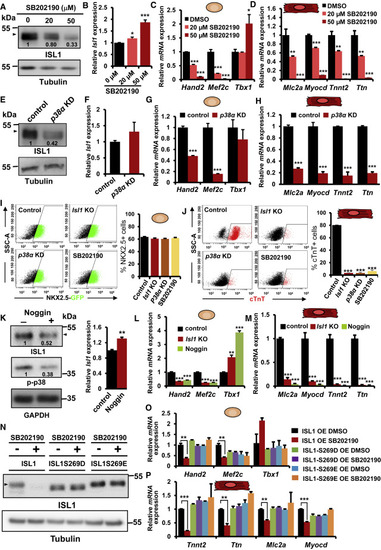
Figure 3. p38 regulates ISL1 stability and function during cardiac differentiation (A and B) WB analysis of protein extracts (A) and Isl1 qPCR analysis (n = 4) (B) of mESC-derived CPCs treated at the MES stage (d4) with different concentrations of SB202190 for 24 h. (C) Relative mRNA expression of Tbx1 and ISL1 downstream targets (Hand2 and Mef2c) in CPCs (d5) treated at the MES stage with different concentrations of SB202190 for 24 h (n = 4). (D) Relative mRNA expression of CM marker genes in CMs (d8) differentiated from cells treated at the cardiac mesoderm stage with different concentrations of SB202190 for 96 h (n = 4). (E and F) WB analysis of protein extracts (E) and Isl1 qPCR analysis (n = 4) (F) of CPCs (d5) derived from mESCs stably overexpressing control small hairpin RNA (shRNA) or shRNA against p38α. (G and H) Relative mRNA expression of Tbx1, Hand2, and Mef2c in CPCs (d5, n = 4) (G) and of CM marker genes in CMs (d8, n = 4) (H), differentiated from control and p38α knockdown mESCs. (I) Representative FACS analyses of NKX2.5 + CPCs differentiated from Isl1−/− and p38α knockdown mESCs or mESCs treated with p38 inhibitor at the MES stage for 24 h (left). Percentage of NKX2.5+ CPCs at d5 determined by FACS analysis (n = 3) (right). (J) Representative FACS analyses of cTnT+ CMs at d10 of ESC differentiation (left) and percentage of cTnT+ CMs at d10 determined by FACS analysis (n = 3) (right). (K) WB analysis of protein extracts (left) and Isl1 qPCR analysis (right) of Isl1−/− CPCs overexpressing CMV-driven Isl1 treated with Noggin at the MES stage for 24 h. (L and M) Relative mRNA expression of Tbx1, Hand2, and Mef2c in CPCs (d5, n = 4) (L) and of CM marker genes in CMs (d8, n = 4) (M), differentiated from cells treated with Noggin from the MES stage. (N) WB analysis of protein extracts from CPCs derived from Isl1−/− mESCs overexpressing EF1α-driven Isl1 or Isl1 carrying phosphomimetic mutations of serine 269 (ISL1S269D, ISL1S269E) treated either with DMSO or SB202190 at the MES stage for 24 h. (O and P) Relative mRNA expression of Tbx1, Hand2, and Mef2c in CPCs (d5, n = 4) (O) and of CM marker genes in CMs (d8, n = 4) (P), differentiated from Isl1−/− mESCs overexpressing ISL1, ISL1S269E, or ISL1S269D treated either with DMSO or SB202190 from the MES stage. |