
- Title
-
The RNA helicase Ddx52 functions as a growth switch in juvenile zebrafish
- Authors
- Tseng, T.L., Wang, Y.T., Tsao, C.Y., Ke, Y.T., Lee, Y.C., Hsu, H.J., Poss, K.D., Chen, C.H.
- Source
- Full text @ Development
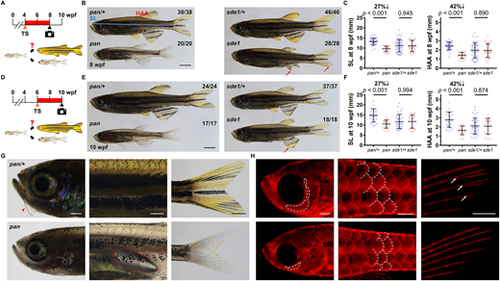
Temperature-sensitive pan mutant has defects in juvenile growth. (A) Timeline of the temperature shift experiment during zebrafish development. TS, temperate shift; wpf, weeks post-fertilization. Red bar indicates time at 34°C. (B) Whole-mount images of pan and pan/+ individuals at 8 wpf (stitched) and sde1 ts mutants, which were included as an experiment control for the effect of the restrictive temperature on regeneration mutants. Blue solid line indicates the measurement of standard length (SL). Red solid line indicates the measurement of height at anterior of anal fin (HAA). Red arrows point to severely degraded fin tissues in sde1. Scale bar: 2 mm. (C) Measurements of SL and HAA at 8 wpf (n=38 pan/+, 20 pan, 46 sde1/+, 28 sde1; mean±s.d.; two-tailed Student's t-test). (D) Timeline of a second temperature shift experiment during zebrafish development. (E) Whole-mount images of pan and pan/+ individuals at 10 wpf (stitched) and sde1 ts mutants (experiment control for the effect of the restrictive temperature on regeneration mutants). Red arrow points to degraded fin tissues in sde1. Scale bar: 2 mm. (F) Measurements of SL and HAA at 10 wpf (n=24 pan/+, 17 pan, 37 sde1/+, 18 sde1; mean±s.d.; two-tailed Student's t-test). (G) Bright-field images of pan/+ and pan at 8 wpf after a 4-week incubation at 34°C. Red arrowhead points to the growth of adult barbels. Red dashed line indicates a swim bladder. Trunk areas and tailfins in pan fish remain mostly transparent, presumably as a result of defects in the generation of adult pigmentation patterns. Scale bars: 0.5 mm (left); 1 mm (middle and right). (H) Fluorescence images of pan at 8 wpf after a 4-week incubation at 34°C. Mature calcified bone structures were detected by Alizarin Red staining. pan lacks several craniofacial bones (left, dashed lines), displays defects in scale maturation (middle, dashed lines depict scale margins) and the tailfin has no bifurcation points (right, white arrows), a landmark feature in adult tailfin bony rays. Scale bars: 0.5 mm. PHENOTYPE:
|
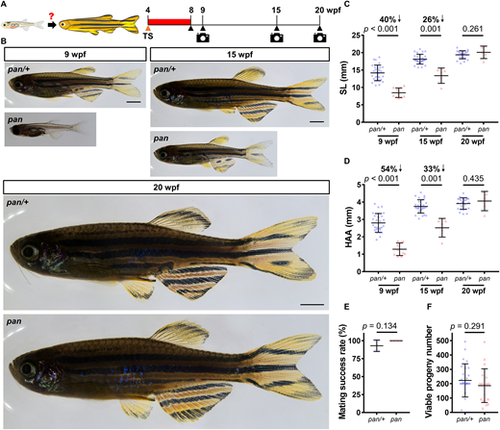
Delayed growth phenotypes in pan are fully reversible. (A) Timeline of the temperature shift experiment during zebrafish development. TS, temperature shift; wpf, weeks post-fertilization. Red bar indicates the time at 34°C. (B) Whole-mount images of pan and pan/+ individuals after 4 weeks at 34°C (stitched). Following release from the restrictive temperature, images were captured at 9, 15 and 20 wpf. Scale bars: 2 mm. (C,D) Measurements of SL and HAA at 9, 15 and 20 wpf (9 wpf: n=28 pan/+, 10 pan; 15 wpf: 28 pan/+, 5 pan; 20 wpf: 25 pan/+, 5 pan; mean±s.d.; two-tailed Student's t-test). (E,F) Mating success rates and viable progeny numbers produced by each male pan/+ and pan individual (from four independent crosses). Consecutive crosses were set up with wild-type females at 2-week intervals (n=7 pan/+, 5 pan; mean±s.d.; two-tailed Student's t-test). PHENOTYPE:
|
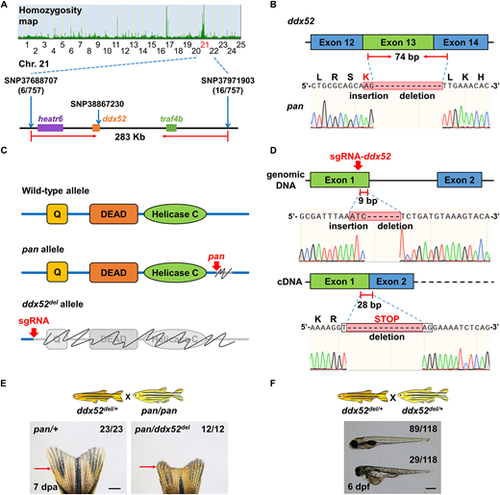
ddx52 is the pan gene. (A) High-resolution mapping of linked SNP markers in pan. Six and 16 recombinants were respectively identified for SNP37688707 and SNP37971903. SNP38867230 in ddx52 exon 14 was used for detection of the pan allele. (B) Sanger sequencing readouts from pan cDNA. The ddx52 sequence contains an in-frame indel that affects exons 13 and 14. (C) The three major structural domains of ddx52: Q motif, DEAD-box domain and helicase C domain. Gray color and scribble lines indicate regions that are affected in the pan allele and the ddx52del allele. (D) Illustration of and Sanger sequencing readouts depicting the sgRNA targeting site. The resulting ddx52del allele produces an out-of-frame indel that leads to an early stop codon in exon 2. (E) The ddx52del allele fails to complement the pan tailfin regeneration defect in adult animals. All adult animals with or without regeneration defects at the restrictive temperature had expected genotypes (n=23 pan/+, 12 pan/ddx52del). Red arrows indicate the amputation plane. Scale bar: 1 mm. (F) Whole-mount images of ddx52del×ddx52del embryos at 26°C. Approximately 25% of embryos had severe developmental defects at 6 days post-fertilization (dpf). Scale bar: 0.5 mm. |
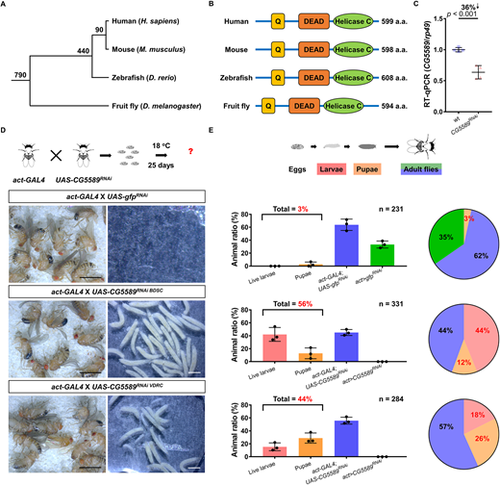
Genetic silencing of the ddx52 ortholog impedes development in the fruit fly. (A) A phylogenetic tree of vertebrate and invertebrate animals. Zebrafish, mice and fruit flies were examined in this study. The numbers next to each node indicate how many millions of years ago divergence took place. (B) The major structural domains of Ddx52 are conserved in different animal species. (C) RT-qPCR assay indicating the reduction of ddx52 expression level in progeny from the act-GAL4×UAS-CG5589RNAi BDSC cross. qPCR results were normalized to rp49 (n=4 per group; 40 larvae in each group; mean±s.e.m.; two-tailed Student's t-test). (D) Developmental phenotypes in the fruit fly upon genetic silencing of the ddx52 ortholog, CG5589. In the gfpRNAi control crosses, no live larvae were found after 25 days. In contrast, a large number of live larvae and pupae were detected in both of the CG5589RNAi crosses. (E) Schematic shows the developmental trajectory of fruit flies. Bar charts show the percentages of animals detected at each developmental stage (mean±s.d.). The numbers on the top right corner of each bar chart indicate the total numbers of animals examined in three independent crosses. Pie charts summarize the percentages of animals at each developmental stage. |

Ddx52 maintains 47S pre-rRNA and bulk RNA transcriptions in proliferating tissues. (A) Illustration depicting the processing of ribosomal RNAs. Once transcribed, the 47S pre-rRNA is immediately processed into 18S, 5.8S and 28S rRNAs. Red arrow points to the 5′-external transcribed space (5′ETS), the level of which often serves as a readout for the quantity of 47S pre-rRNA. (B) Timeline of the temperature shift experiment during tailfin regeneration. AR, after recovery at 26°C; dpa, days post-amputation; TS, temperature shift. Red bar indicates time at 34°C. (C) RT-qPCR assay indicating a marked reduction in the 5′ETS level after a 6-h incubation at 34°C. qPCR results were normalized to actb (n=4 per group; mean±s.e.m.; two-tailed Student's t-test). (D) RT-qPCR assay indicating no change in the 18S level after a 6-h incubation at 34°C. qPCR results were normalized to actb (n=4 per group; mean±s.e.m.; two-tailed Student's t-test). (E) Timeline of the temperature shift and EU assay during tailfin regeneration. Orange arrowhead marks the EU injection time. TS, temperature shift. Red bar indicates time at 34°C. (F) Whole-mount EU staining of pan and sde1 tailfin regenerates at 4 dpa after a 6-h incubation at 34°C. White dashed lines outline the distal margin of the fin tissue. Yellow brackets mark the blastema compartment. Scale bar: 50 μm. Graphs show quantification of EU+ cells in the lateral 2nd bony ray (n=24 pan/+, 22 pan; 13 sde1/+, 19 sde1; mean±s.d.; two-tailed Student's t-test). (G) Timeline of the temperature shift and EdU assay during tailfin regeneration. Orange arrowhead marks the EdU injection. Red bar indicates time at 34°C. (H) Whole-mount EdU staining of pan and mem tailfin regenerates at 4 dpa after a 2-h incubation at 34°C. White dashed lines outline the distal margin of the fin tissue. Yellow brackets mark the blastema compartment. Scale bar: 50 μm. Graphs show quantification of EdU+ cells in the lateral 2nd bony ray (n=14 pan/+, 16 pan; 28 mem/+, 18 mem; mean±s.d.; two-tailed Student's t-test). |
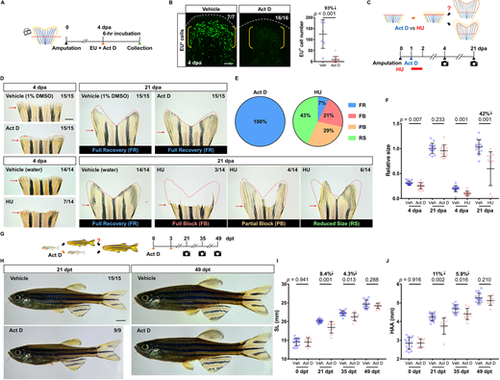
Pharmacological inhibition of bulk RNA transcription reversibly pauses regeneration and growth in zebrafish. (A) Timeline of actinomycin D (Act D) treatment and EU assay during tailfin regeneration. Orange arrowhead marks the EU and Act D injection time. Green arrowhead marks the collection time. (B) Whole-mount EU staining of the wild-type tailfin regenerates at 4 dpa after a 6-h treatment of Act D. White dashed lines outline the distal margin of the fin tissue. Yellow brackets mark the blastema compartment. Scale bar: 50 μm. Graph shows quantification of EU+ cells in the lateral 2nd bony ray (n=7 vehicle, 16 Act D; mean±s.d.; Mann–Whitney U test). (C) Timeline of Act D and HU treatment during tailfin regeneration. In the Act D group, individuals at 1 dpa were intraperitoneally injected with either vehicle or Act D, as indicated by a blue arrowhead. In the HU group, individuals at 1 dpa were incubated in either vehicle or HU for 24 h, as indicated by a red bar. Fin regenerates were imaged at 4 and 21 dpa. (D) Whole-mount images of the Act D/HU-treated WT fin regenerates at 4 and 21 dpa. Red arrows indicate amputation plane. Red dashed lines depict respective fin region prior to the amputation to facilitate visual comparison. Scale bar: 1 mm. (E) Pie charts summarizing proportions of fin regenerate phenotypes at 21 dpa. Left: All of the regenerates in the Act D group (15/15) fully recovered. Right: Fin regenerates in the HU group displayed high variation. Only 7% of the animals (1/14) fully recovered. FB, full block; FR, full recovery; PB, partial block; RS, reduced size. (F) Quantification of the relative fin regenerate size. Data from each individual were normalized to their original fin sizes (n=15 vehicle, 15 Act D; 14 vehicle, 14 HU; mean±s.d.; two-tailed Student's t-test). (G) Timeline of Act D treatment in juvenile zebrafish. Individuals at 11 weeks of age were intraperitoneally injected twice with either vehicle or Act D, as indicated by orange arrowheads. Images were captured at 21, 35 and 49 days after the first treatment (dpt). (H) Whole-mount images of the vehicle- and Act D-treated zebrafish at 21 and 49 dpt (stitched). Scale bar: 2 mm. (I,J) Measurements of SL and HAA at 0, 21, 35 and 49 dpt (n=15 vehicle, 9 Act D; mean±s.d.; two-tailed Student's t-test). PHENOTYPE:
|
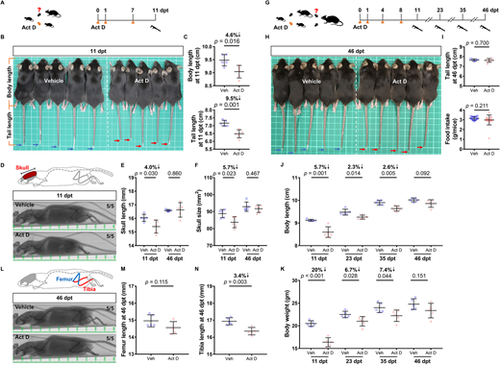
Transient inhibition of RNA transcription reversibly pauses growth in mice. (A) Timeline of Act D treatment in juvenile mice. Mice at 4 weeks of age were intraperitoneally injected with either vehicle or Act D three times, as indicated by orange arrowheads. Caliper indicates measurement. (B) Bright-field image of the mice at 11 dpt. Blue and red arrows point to mouse tail-tips. White squares are 1 cm on each side. (C) Measurements of body length and tail length at 11 dpt (n=5 vehicle, 5 Act D; mean±s.d.; two-tailed Student's t-test). (D) Top: Illustration of mouse skull. Measured regions are highlighted in red. Bottom: Micro-CT scans of vehicle- and Act D-treated mice at 11 dpt. Major unit: 1 cm. (E,F) Measurements of skull length and skull size at 11 and 46 dpt (n=5 vehicle, 5 Act D; mean±s.d.; two-tailed Student's t-test). (G) Timeline of Act D treatment in juvenile mice in a repeated experiment. Mice at 4 weeks old were injected intraperitoneally with either vehicle or Act D four times, as indicated by the orange arrowheads. (H) Bright-field image of the mice at 46 dpt. Blue and red arrows point to mouse tail-tips. White squares are 1 cm on each side. (I) Measurements of tail length at 46 dpt and average daily food intake (4 to 46 dpt) (n=5 vehicle, 5 Act D from a total of 15 measurements; mean±s.d.; two-tailed Student's t-test for tail length analysis; Mann–Whitney U-test for average daily food intake). (J,K) Measurements of body length and body weight at 11, 23, 35 and 46 dpt (n=5 vehicle, 5 Act D; mean±s.d.; two-tailed Student's t-test). (L) Top: Illustration of relevant mouse bone structures. Femur (blue) and tibia (red) bone lengths were compared. Bottom: Micro-CT scans of vehicle- and Act D-treated mice at 46 dpt. Major unit: 1 cm. (M,N) Measurements of femur and tibia bone lengths at 46 dpt (n=5 vehicle, 5 Act D; mean±s.d.; two-tailed Student's t-test). |

ZFIN is incorporating published figure images and captions as part of an ongoing project. Figures from some publications have not yet been curated, or are not available for display because of copyright restrictions. PHENOTYPE:
|
|
ZFIN is incorporating published figure images and captions as part of an ongoing project. Figures from some publications have not yet been curated, or are not available for display because of copyright restrictions. EXPRESSION / LABELING:
PHENOTYPE:
|