
Fig. 7
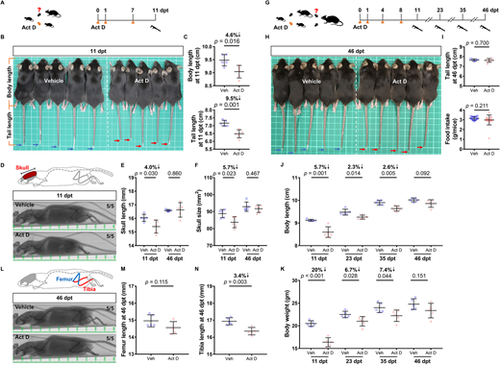
Transient inhibition of RNA transcription reversibly pauses growth in mice. (A) Timeline of Act D treatment in juvenile mice. Mice at 4 weeks of age were intraperitoneally injected with either vehicle or Act D three times, as indicated by orange arrowheads. Caliper indicates measurement. (B) Bright-field image of the mice at 11 dpt. Blue and red arrows point to mouse tail-tips. White squares are 1 cm on each side. (C) Measurements of body length and tail length at 11 dpt (n=5 vehicle, 5 Act D; mean±s.d.; two-tailed Student's t-test). (D) Top: Illustration of mouse skull. Measured regions are highlighted in red. Bottom: Micro-CT scans of vehicle- and Act D-treated mice at 11 dpt. Major unit: 1 cm. (E,F) Measurements of skull length and skull size at 11 and 46 dpt (n=5 vehicle, 5 Act D; mean±s.d.; two-tailed Student's t-test). (G) Timeline of Act D treatment in juvenile mice in a repeated experiment. Mice at 4 weeks old were injected intraperitoneally with either vehicle or Act D four times, as indicated by the orange arrowheads. (H) Bright-field image of the mice at 46 dpt. Blue and red arrows point to mouse tail-tips. White squares are 1 cm on each side. (I) Measurements of tail length at 46 dpt and average daily food intake (4 to 46 dpt) (n=5 vehicle, 5 Act D from a total of 15 measurements; mean±s.d.; two-tailed Student's t-test for tail length analysis; Mann–Whitney U-test for average daily food intake). (J,K) Measurements of body length and body weight at 11, 23, 35 and 46 dpt (n=5 vehicle, 5 Act D; mean±s.d.; two-tailed Student's t-test). (L) Top: Illustration of relevant mouse bone structures. Femur (blue) and tibia (red) bone lengths were compared. Bottom: Micro-CT scans of vehicle- and Act D-treated mice at 46 dpt. Major unit: 1 cm. (M,N) Measurements of femur and tibia bone lengths at 46 dpt (n=5 vehicle, 5 Act D; mean±s.d.; two-tailed Student's t-test). |