
|
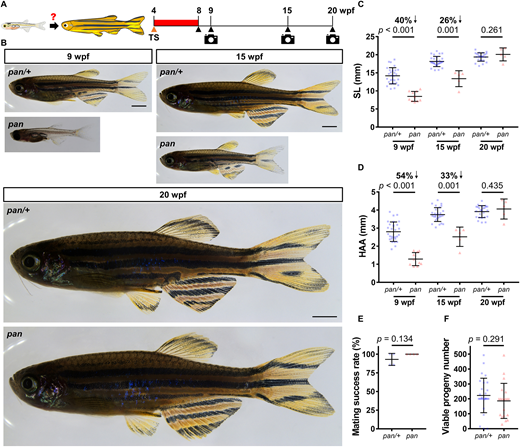
Fig. 2 Delayed growth phenotypes in pan are fully reversible. (A) Timeline of the temperature shift experiment during zebrafish development. TS, temperature shift; wpf, weeks post-fertilization. Red bar indicates the time at 34°C. (B) Whole-mount images of pan and pan/+ individuals after 4 weeks at 34°C (stitched). Following release from the restrictive temperature, images were captured at 9, 15 and 20 wpf. Scale bars: 2 mm. (C,D) Measurements of SL and HAA at 9, 15 and 20 wpf (9 wpf: n=28 pan/+, 10 pan; 15 wpf: 28 pan/+, 5 pan; 20 wpf: 25 pan/+, 5 pan; mean±s.d.; two-tailed Student's t-test). (E,F) Mating success rates and viable progeny numbers produced by each male pan/+ and pan individual (from four independent crosses). Consecutive crosses were set up with wild-type females at 2-week intervals (n=7 pan/+, 5 pan; mean±s.d.; two-tailed Student's t-test).