
- Title
-
Myelination induces axonal hotspots of synaptic vesicle fusion that promote sheath growth
- Authors
- Almeida, R.G., Williamson, J.M., Madden, M.E., Early, J.J., Voas, M.G., Talbot, W.S., Bianco, I.H., Lyons, D.A.
- Source
- Full text @ Curr. Biol.
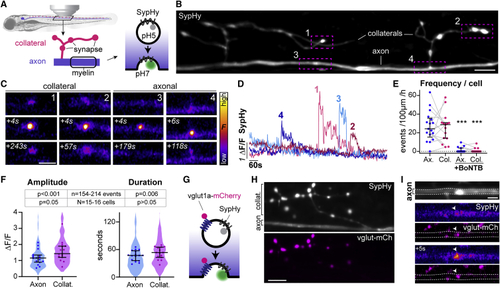
SypHy reveals vesicular fusion along reticulospinal axons (A) Morphology of reticulospinal axons in the developing zebrafish spinal cord. SypHy, a synaptophysin-pHluorin fusion protein, reports synaptic vesicle exocytosis. (B) Individual SypHy+ reticulospinal axon (dorsal up) with synapse-bearing collateral branches. (C and D) SypHy events at collaterals and axon (C) and fluorescence time courses (D). (E) SypHy frequency is similar in axons and collaterals (gray lines shows respective events of same cell); and abolished in BoNTB+ neurons (p = 0.82 Ax versus Col; p < 0.001 Ax versus Ax+BoNTB; p < 0.001 Col versus Col+BoNTB; Mann-Whitney test, 17 control axons from 16 animals; 15 BoNTB axons from 15 animals). (F) Amplitude and duration of SypHy events in reticulospinal axons. Violin plots represent all analyzed events and circles denote average per axon (p = 0.054 Ax versus Col amplitude, p = 0.264 Ax versus Col duration, Mann-Whitney tests; n = 154 axonal and 214 collateral events from N = 16 axons from 15 animals). (G–I) vglut1a-mCherry co-expression with SypHy (G) shows co-localization at synaptic terminals in collateral branches (H) and at axonal puncta (I). Scale bars, 5 μm (B, H, and I), 2 μm (C). Graphs display median and interquartile range. See also |

Axonal vesicular fusion coincides with the onset of myelination (A and B) tdTcntn1a profile of a myelinated (A) and a not-yet myelinated (B) reticulospinal axon. tdTcntn1a is excluded from myelinated regions along axons. SypHy average projections and corresponding kymographs of the axonal segments in panels below. Basal SypHy signal is decreased along sheaths, suggesting surface SypHy displacement by myelin. SypHy events are present in non-myelinated regions (asterisks), myelinated regions (arrows) and at the tdTcntn1a+/tdTcntn1a− border (arrowheads). (C) Axonal, but not collateral, SypHy frequency in myelinated reticulospinal axons is greater than in unmyelinated axons (axonal, p = 0.001; collateral, p = 0.30; Mann-Whitney test; axonal rates, 19 unmyelinated axons from 19 animals and 75 myelinated axons from 68 animals). Scale bars, 5 μm, 60 s (A and B). Graphs display median and interquartile range. See also |
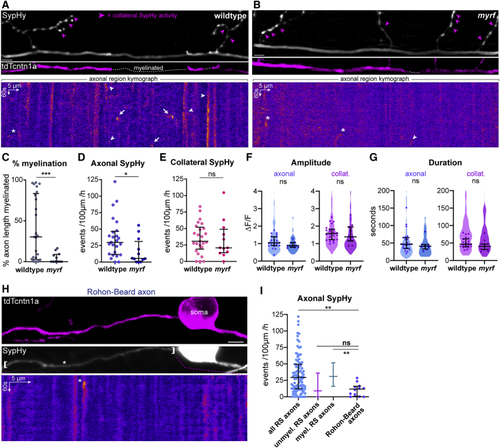
Myelination promotes vesicular fusion along reticulospinal axons (A and B) SypHy activity and myelination profile of reticulospinal axons in wild-type (WT) (A) and hypomyelinated (C) Myelin coverage in WT and (D and E) Axonal (D), but not collateral (E), SypHy frequency is decreased in (F and G) Amplitude (F) and duration (G) of SypHy events is similar in WT and (H) Myelination profile and SypHy activity of a Rohon-Beard axon. Kymograph of bracketed region. (I) Axonal SypHy frequency in rarely myelinated Rohon-Beard axons is significantly reduced compared to reticulospinal axons (p = 0.006 all RS versus Rohon-Beard, p > 0.05 unmyelinated. RS versus Rohon Beard, p = 0.001 myelinated. RS versus Rohon Beard; Kruskal-Wallis with Dunn’s multiple comparison test, 94 RS axons in 87 animals and 12 Rohon-Beard axons from 11 animals). Scale bars, 5 μm, 60 s (A, B, and H). Graphs display median and interquartile range. See also |
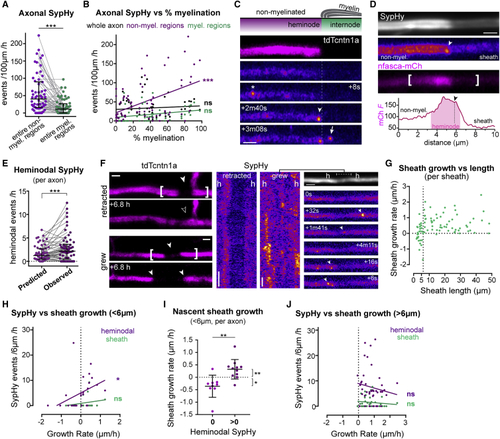
Axonal vesicular fusion is enriched at heminodes during nascent sheath growth (A) Within myelinated axons, SypHy is more frequent in non-myelinated regions (p < 0.0001, Wilcoxon matched-pairs signed-rank test, 58 myelinated axons from 53 animals). (B) Percent myelination correlates with SypHy frequency in non-myelinated regions (Pearson’s r, 0.46, p < 0.0001; in myelinated regions r, 0.25, p = 0.05; in whole axon r, 0.10, p = 0.43). (C) SypHy activity near a putative heminode, annotations as in (D) nfasca-mCherry is enriched at putative heminodes (arrowhead, heminodal SypHy event). Graph indicates mCherry fluorescence intensity profile (in a.u.) along bracketed region. (E) Observed heminodal Syphy frequency is higher than predicted if events in non-myelinated regions were uniformly distributed (p = 0.0004, Wilcoxon matched-pairs rank test, 58 axons from 53 animals). (F) tdTcntn1a profiles and SypHy activity in retracting and growing nascent sheaths (h = heminode). (G) Relation between sheath length and growth rate, note sheaths <6 μm may grow or shrink, but >6 μm sheaths mostly grow (85 sheaths from 39 axons in 35 fish). (H) Nascent sheath growth rate correlates with heminodal SypHy frequency (Pearson’s r: 0.39, p = 0.043) but not under the sheath (Pearson’s r: 0.31, p = 0.111). 85 sheaths from 39 axons from 36 animals. (I) Nascent sheaths with heminodal SypHy activity grow faster than those without (p = 0.001 with versus without, Mann-Whitney test; p = 0.01 and p = 0.039 non-zero growth rate with and without heminodal SypHy, one-sample Wilcoxon test; 23 sheaths in N = 14 axons from 13 animals). (J) Growth rate of sheaths >6 μm does not correlate with SypHy activity (heminodal Pearson’s r: −0.14, p = 0.381; sheath Pearson’s r: −0.12, p = 0.441). Scale bars, 2 μm (C, D, and F), 60 s (F). Graphs display median and interquartile range. See also |
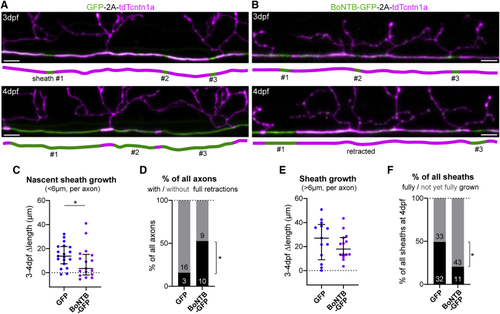
Axonal vesicular fusion consolidates nascent myelin sheaths (A and B) Examples of 3–4 dpf time-course analyses of myelination of control RS axons (GFP-2A-tdTcntn1a) and RS axons with blocked vesicular fusion (BoNTB-GFP-2A-tdTcntn1a). (C) Nascent sheaths in axons with blocked vesicular fusion grow slower (p = 0.048, Mann-Whitney test, 19 control axons from 18 animals and 17 BoNTB axons from 15 animals). (D) Proportion of axons with and without full sheath retractions (p = 0.038, Fisher’s exact test). Numbers in bars indicate absolute number of axons. (E) Sheaths >6 μm have a non-significant slower median growth in BoNTB-silenced axons (p = 0.488, Mann-Whitney test, 13 control axons from 13 animals and 14 BoNTB axons from 13 animals). (F) Proportion of sheaths at 4 dpf fully grown (flanked by nodes and/or collaterals) or still with space to grow (p = 0.001, Fisher’s exact test). Numbers in bars indicate absolute number of sheaths. Scale bars, 5 μm (A and B). Graphs display median and interquartile range. See also |
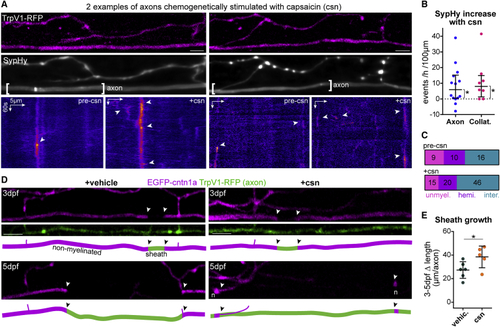
Chemogenetic stimulation of vesicular fusion promotes sheath growth (A) Two examples of SypHy activity in TrpV1-tagRFP+ reticulospinal axons before (pre-csn) and during capsaicin treatment (+csn). (B) Capsaicin increased axonal and collateral SypHy in TrpV1+ neurons above baseline (difference from zero: p = 0.013 axonal, p = 0.031 collateral, Wilcoxon signed-rank test, 14 axons and 8 collaterals from 14 and 8 animals, respectively). (C) Axonal event distribution before (n = 35 events) and after (n = 81 events) csn treatment. (D) Single TrpV1+ axons treated with vehicle or capsaicin throughout myelination (arrowheads, putative heminodes; n, putative nodes of Ranvier). (E) Stimulation promotes sheath growth (3–5 dpf change: p = 0.04, Student’s t test). 6 control axons and 5 stimulated axons from 6 and 5 animals, respectively. Scale bars, 5 μm (A), 10 μm (D), 60 s (A). Graphs in (B) shows median and interquartile range and graphs in (E) display mean and standard deviation. See also |

COPA neurons have limited axonal vesicular fusion (A) Morphology of COPA axons in the developing zebrafish spinal cord. (B and C) Two examples of COPA axons, their myelination profiles and SypHy activity. Magenta arrowheads indicate collateral SypHy activity. Kymographs represent SypHy activity of bracketed axonal region. (D) Myelin coverage is similar in reticulospinal and COPA axons (p = 0.291, Mann-Whitney test, 66 RS axons in 57 animals and 19 COPA axons from 19 animals). (E) Axonal, but not collateral SypHy frequency is reduced in COPA axons compared to reticulospinal datasets (axonal: p = 0.043 RS1 versus COPA, p = 0.002 RS2 versus COPA; collateral: p > 0.99 RS1 versus COPA, p > 0.99 RS2 versus COPA; Kruskal-Wallis with Dunn’s multiple comparison test; N as in (F) Axonal SypHy frequency is comparable in myelinated and unmyelinated COPA axons (p = 0.237, Mann-Whitney test, 8 unmyelinated and 11 myelinated COPA axons from 19 animals). (G) Within myelinated COPA axons, SypHy frequency is higher in non-myelinated regions (p = 0.024, Wilcoxon matched-pairs signed-rank test, 11 myelinated COPA axons from 11 animals). Scale bars, 10 μm (A), 5 μm, and 60 s (B and C). Graphs display median and interquartile range. See also |