
- Title
-
Activation of PKG restricts melanoma growth and invasion by interfering with the EGF/EGFR pathway
- Authors
- Quadri, M., Comitato, A., Palazzo, E., Tiso, N., Rentsch, A., Pellacani, G., Marconi, A., Marigo, V.
- Source
- Full text @ J. Invest. Dermatol.
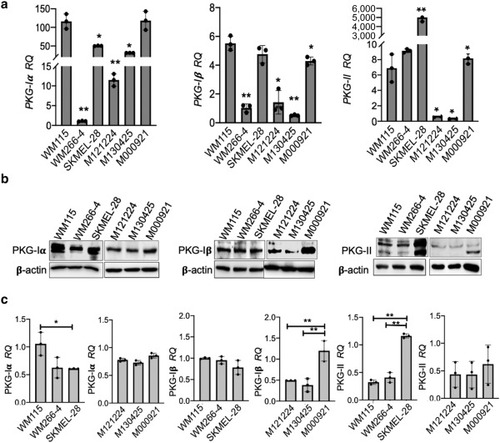
Expression of PKG isoforms in melanoma spheroids. (a) RQs of the PKG-Iα, PKG-Iβ, and PKG-II mRNAs were assessed by real-time qPCR in melanoma cell lines (WM115, WM266-4, and SKMEL-28) and human metastatic (M121224, M130425, and M000921) derived spheroids. RPS26 was used as a reference gene. RQ of WM266-4 was set as 1 for PKG-Iα and PKG-Iβ, whereas the value of M130425 was set as 1 for PKG-II. Data represent the mean ± SD of triplicate determinations. Statistical analysis by one-way ANOVA was performed comparing the mRNA level of each sample with WM115 mRNA level. (b) Immunoblotting for PKG isoforms. (c) Quantification of PKG-Iα, PKG-Iβ, and PKG-II RQ was performed by ImageJ using β-actin as a normalizing protein. Data represent the mean ± SD of three independent biological experiments. Statistical analysis by one-way ANOVA was performed comparing the protein level of each sample with WM115 or M000921 protein levels. ∗∗P < 0.01; ∗0.01 < P < 0.05. PKG, protein kinase G; RQ, relative quantity. |

Cell viability after treatment with cGMP analogs in melanoma spheroids and human melanocytes. (a) Dose‒response relationships of melanoma cell spheroids viability after exposure to different doses of PA4 and PA5 for 24 h. Values of NT cells were set as 100% of cell viability. (b) Cell viability in human metastatic melanoma spheroids treated with PA5 (250 nM) for 24 h. Values of NT cells were set as 100% of cell viability. (c) Viability time course of melanoma cell line‒derived spheroids treated with PA5 (250 nM). Cell viabilities at each time point were expressed as a percentage compared with that of time 0. (d) PA5 toxicity was evaluated in human primary melanocytes by MTT assay. Values of NT cells were set as 100% of cell viability. Data represent means ± SD of triplicate determinations. Student’s t-test was applied for statistical analyses of PA5-treated samples compared with NT. ∗∗P < 0.01; ∗0.01 < P < 0.05. h, hour; NT, not treated; PA, protein kinase G activator. |

Effect of PA5 on melanoma viability. Melanoma spheroids were treated with PA5 from 24 to 72 h. (a) Pictures of spheroids taken at different time points. (b) Total areas occupied by spheroids were evaluated by ImageJ software. (c) Melanoma spheroids were treated with PA5 (250 nM), and dying cells were stained with PI at 24 and 72 h. Quantification of dying cells is presented as PI staining/spheroids area. Bars = 100 μm. Data represent means of at least three spheroids ± SD of triplicate biological experiments. Student’s t-test was used for statistical analyses of PA5-treated samples compared with NT. ∗∗P < 0.01; ∗0.01 < P < 0.05. h, hour; NT, not treated; PA, protein kinase G activator; PI, propidium iodide. |
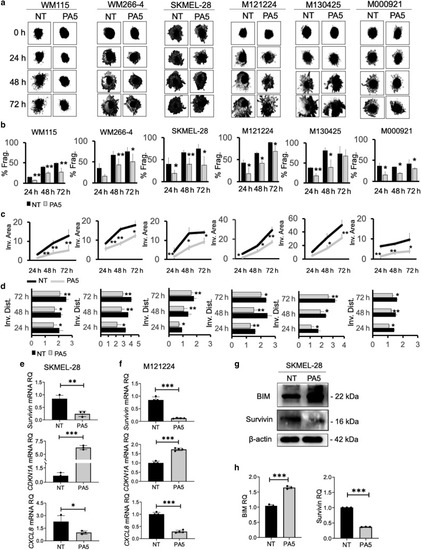
Effect of PA5 on melanoma spheroids invasion and survival. Melanoma spheroids were transferred onto a type I collagen matrix. At 24 h later, spheroids were treated with PA5. (a) Pictures of treated or NT spheroids were taken every 24 h up to 72 h. (b) Histograms representing the % Frag. of PA5-treated or -NT spheroids at each time point. (c) Graphs representing the changes of the Inv. areas of PA5-treated spheroids versus that of NT spheroids evaluated by the ImageJ software. (d) Histograms representing the Inv. Dist. reached by cells in treated versus those reached by NT spheroids. Data represent the means of at least three spheroids ± SD of triplicate biological experiments. Student’s t-test was used for statistical analyses of PA5-treated samples compared with NT. (e) SKMEL-28‒ and (f) M121224-derived spheroids were treated with PA5 (250 nM) for 24 h, and the expression (RQ) of BIRC5, CDKN1A, and CXCL8 mRNAs was evaluated by real-time qPCR. β-Actin was used as a reference gene. Data represent the mean ± SD of triplicate determinations. Student’s t-test was used for statistical analysis. (g) BIM and Survivin protein levels in SKMEL-28 spheroids after PA5 treatment. (h) Protein levels (RQ) represented as mean of protein/β-actin ratio ± SD from three biological replicates. NT data were set as 1. Student’s t-test was applied for statistical analysis. ∗∗∗P < 0.001; ∗∗0.001 < P < 0.01; ∗0.01 < P < 0.05. % Frag., percentage of fragmentation; Dist., distance; h, hour; Inv., invasion; NT, not treated; PA, protein kinase G activator; RQ, relative quantity. |
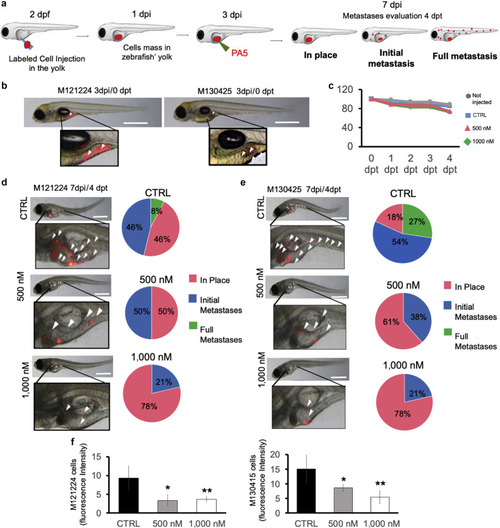
Metastasis repression by PA5 in zebrafish melanoma models. (a) Metastatic cells were labeled with a viable dye and were injected in the zebrafish yolk at 2 dpf. One day after cell injection, zebrafish displaying cells in the circular vessels were discarded. Three days after cell injection, a solution of PA5 (500 nM or 1,000 nM) was injected into the zebrafish yolk. Zebrafish were monitored until 4 dpt (7 dpi). Metastases were classified as follows: (i) in place, cells confined to the site of injection; (ii) initial metastases, cells spread from the yolk to near organs (heart, swim bladder, and pharynx); and (iii) full metastases, cells in distant organs, such as brain, skeletal muscle, and trunk. (b) M121224- and M130425-labeled cells (red) are shown at the time of PA5 injection. Bar = 1 mm (c) Zebrafish were monitored each day up to 4 dpt (7 dpf) to evaluate the mortality rate after treatment. The number of fish on 0 dpt were set as 100% of zebrafish viability. (d, e) Localization of the stained cells (red, indicated with white arrows) was evaluated, and the metastasis was quantified. Bar = 1 mm. (f, g) Cell fluorescence intensities were measured by ImageJ software and normalized on cell fluorescence at time 0. Data represent the means ± SD of three independent biological experiments. Student’s t-test was used for statistical analyses. ∗∗P < 0.01; ∗0.01 < P < 0.05. CTRL, control; dpf, days post fertilization; dpi, days post-injection; dpt, days post-treatment; PA, protein kinase G activator. |
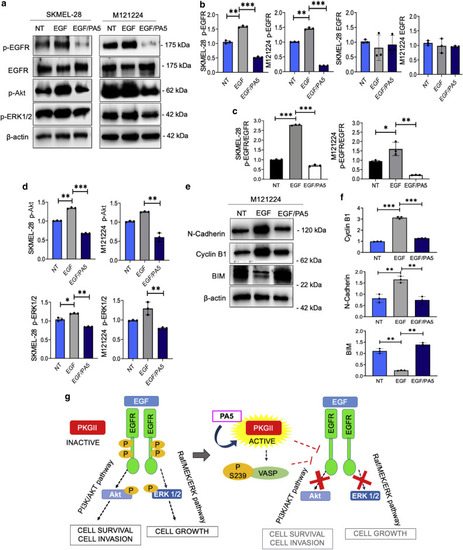
PKG activation by PA5 interferes with the EGF/EGFR pathway. SKMEL-28 and M121224 cells were serum starved for 24 hours, treated with PA5 for 4 hours, and then stimulated with EGF for 30 minutes. (a) Immunoblotting of p-EGFR, EGFR, p-Akt, p-ERK1/2 after exposure to EGF or to EGF together with PA5. (b) RQ of protein levels of p-EGFR and EGFR were calculated by ImageJ software using β-actin as a normalizer. (c) The p-EGFR-to-EGFR ratio was calculated using ImageJ data. (d) Protein levels (RQ) of p-Akt and p-ERK1/2 were calculated by ImageJ software using β-actin as a normalizer. (e) Immunoblotting of N-cadherin, Cyclin B1, and BIM proteins in M121224 cells 24 hours after EGF and PA5 treatment. (f) Proteins levels (RQ) of N-cadherin, Cyclin B1, and BIM were measured by ImageJ software using β-actin as a normalizer. Data represent the means ± SD of three independent biological experiments. Student’s t-test was used for statistical analyses, and P-value was calculated referring to the EGF level. ∗∗∗P < 0.001; ∗∗0.001 < P < 0.01; ∗0.01 < P < 0.05. (g) Schematic representation of the proposed molecular mechanism. ERK, extracellular signal‒regulated kinase; MEK, MAPK/extracellular signal‒regulated kinase; NT, not treated; PA, protein kinase G activator; p-Akt, phosphorylated protein kinase B; p-EGFR, phosphorylated EGFR; p-ERK, phosphorylated extracellular signal‒regulated kinase; PKG, protein kinase G; PI3K, phosphoinositide 3-kinase; RQ, relative quantity. |