
- Title
-
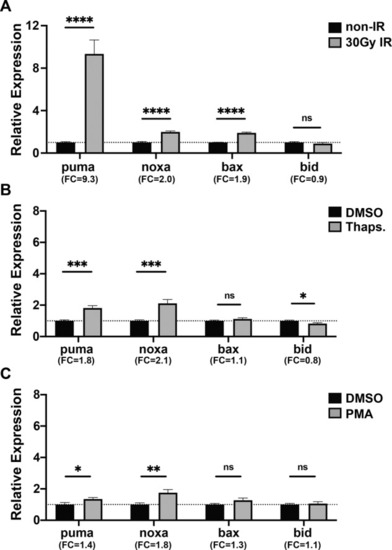
Puma, noxa, p53, and p63 differentially mediate stress pathway induced apoptosis
- Authors
- Wang, J., Thomas, H.R., Li, Z., Yeo, N.C.F., Scott, H.E., Dang, N., Hossain, M.I., Andrabi, S.A., Parant, J.M.
- Source
- Full text @ Cell Death Dis.
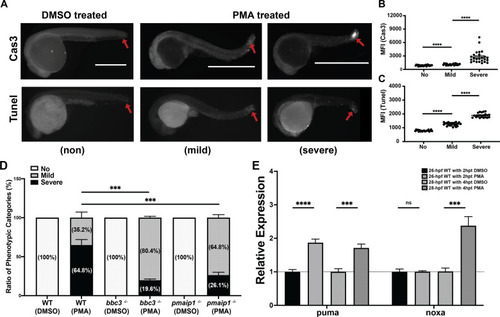
24 hpf zebrafish embryos were treated with |

|
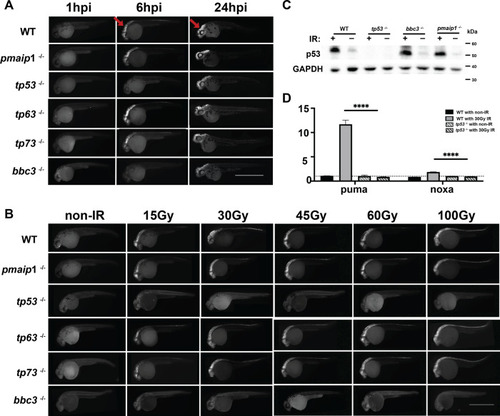
|

EXPRESSION / LABELING:
PHENOTYPE:
|
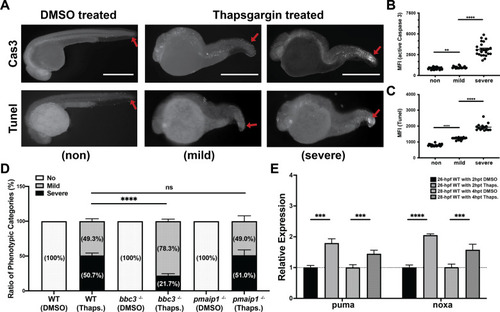
|
PHENOTYPE:
|
|
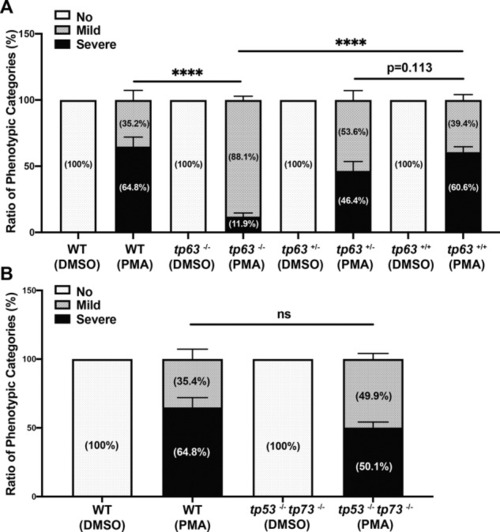
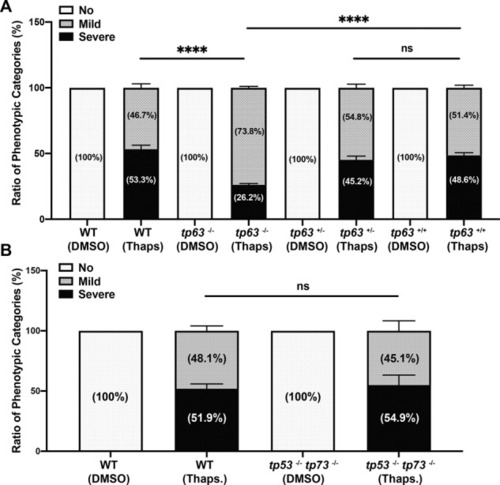
Percentage of phenotypic apoptotic categories in wild type, tp63−/−, sibling tp63+/−, and sibling tp63+/+ zebrafish embryos at 4 h after treatment with DMSO or PMA. B Percentage of phenotypic categories in 24 hpf wild type and tp53−/− tp73−/− zebrafish embryos at 4 h after DMSO or PMA treatment. n = 6 (A) and n = 5 (B) from pooled embryos per sample. The total number of Thaps treated embryos: wild type > 600, tp63−/− > 140, tp63+/− > 390, tp63+/+ > 180, and tp53−/− tp73−/− > 370. Bars represent mean ± SEM. ****p < 0.0001. |