
- Title
-
Rgs4 is a regulator of mTOR activity required for motoneuron axon outgrowth and neuronal development in zebrafish
- Authors
- Mikdache, A., Boueid, M.J., van der Spek, L., Lesport, E., Delespierre, B., Loisel-Duwattez, J., Degerny, C., Tawk, M.
- Source
- Full text @ Sci. Rep.
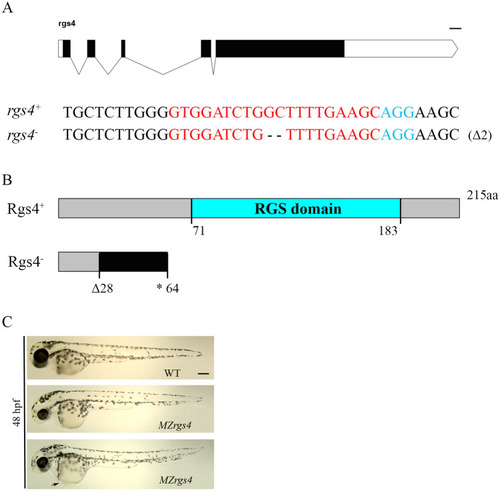
Characterization of PHENOTYPE:
|
EXPRESSION / LABELING:
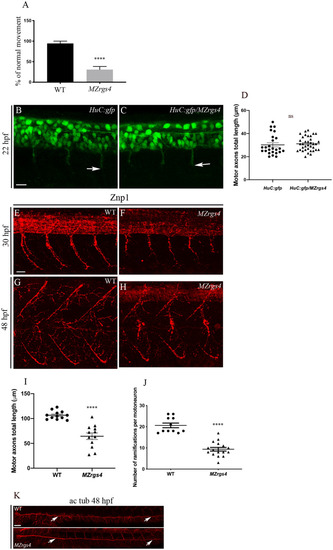
PHENOTYPE:
|
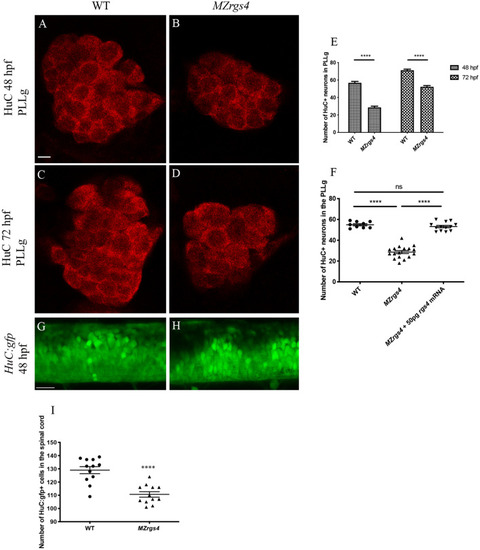
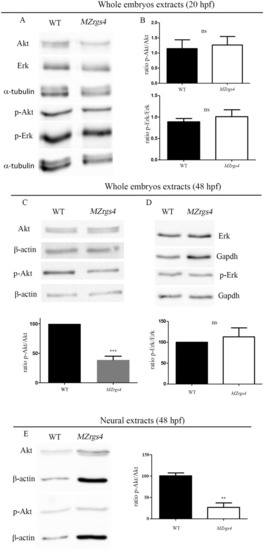
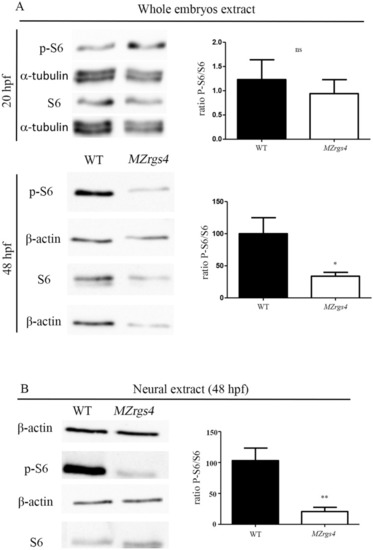
Rgs4 is required for neuronal development in the PLLg and spinal cord. ( EXPRESSION / LABELING:
PHENOTYPE:
|
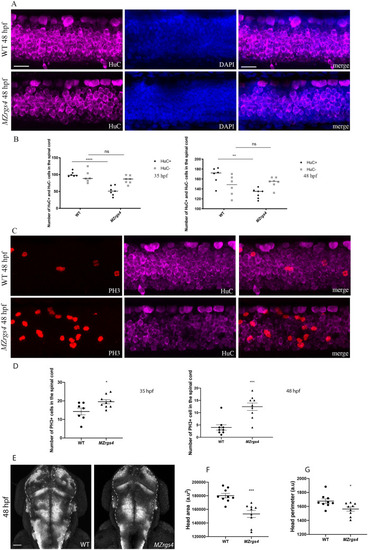
|
Loss of EXPRESSION / LABELING:
PHENOTYPE:
|
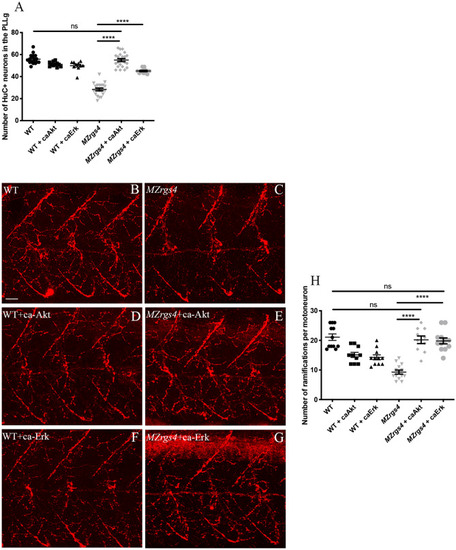
Akt and Erk activities mediate Rgs4-dependent PLLg development and motoneurons branching. ( |
Loss of EXPRESSION / LABELING:
PHENOTYPE:
|
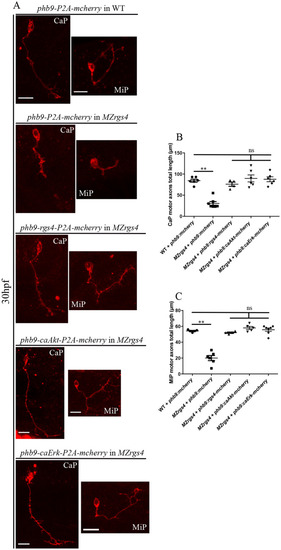
Rgs4 function, Akt and Erk activities that mediate Rgs4-dependent motoneurons outgrowth are all required within motoneurons. ( |