
- Title
-
A transgenic system for targeted ablation of reproductive and maternal-effect genes
- Authors
- Bertho, S., Kaufman, O., Lee, K., Santos-Ledo, A., Dellal, D., Marlow, F.L.
- Source
- Full text @ Development
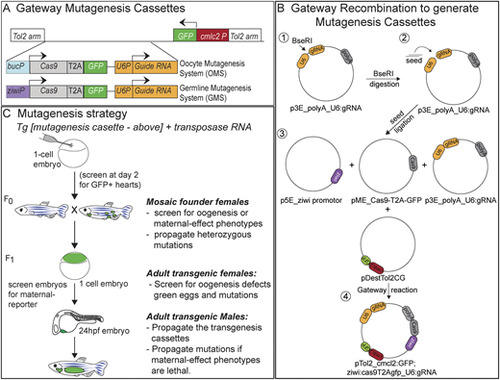
(A) Schematic depicting the mutagenesis systems. Cas9 protein expressed from the buc (oocytes) or ziwi (all germ cells) promoter. Target-specific guides are expressed from the U6 promoter, and GFP is expressed from the ziwi promoter to mark the germline. Mutagenesis system vectors express Cas9 as a single transcript with GFP following a T2A cleavage signal. In addition, GFP is expressed from an independent heart promoter, cardiac myosin light chain 2 (cmlc2), to permit earlier selection of transgenic animals. (B) Schematic of vectors and gateway-mediated recombination to generate OMS and GMS mutagenesis plasmids. (C) Schematic of mutagenesis strategy. |

(A) RT-PCR of indicated genes. Expression from the ziwi promoter is detectable by d10 and buc is detectable later by d31. gRNAs are expressed in transgenic animals identified by GFP+ hearts. cas9 is expressed as expected for the respective promoters. (B) Western blot to detect maternal Cas9 protein (asterisk) in transgenic eggs from GMS:buc transgenic female (2 hpf; 10 egg equivalents/well). (C,D) Expression of GFP in ovary (C) and testis (D) of adult GMS transgenic animals. (E,F) Expression of GFP in ovary (E) but not testis (F) of adult OMS transgenic fish. Four ovaries and four testes were dissected and examined for each transgene. The testis is outlined |

(A) Schematic of expected (and observed) wild-type and Mkif5ba PGC phenotypes. (B,C) Representative restriction enzyme-based assay for kif5ba mutations in (B) F1 and (C) F2 progeny of transgenic adults. Chart in C shows the expected and observed mutation frequencies for each cross. Plus indicates MboI digested; minus indicates undigested. #×# indicates the individuals intercrossed from F1 fish shown in B. (D) Schematic of Kif5Ba protein, the targeted region and representative mutant sequences. (E) nanos3 staining of embryos from three independent clutches of F1 GMS:kif5ba mothers. Black dashed circles highlight PGCs, all others shown lack germ cells (see also Fig. S4). GMS:kif5ba F2. (F,F′) V1 ventralized embryo. (G,G′) V2 ventralized embryo. (H,H′) V3 ventralized embryo. (I,I′) V5 ventralized embryo. (J) Quantification of ventralization classes. (K) Representative kif5bbe6/e6 larvae injected with kif5ba guide RNA and Cas9 (‘crispants’) at d5. (L) Representative kif5bbe6/e6 larvae injected with GMS:kif5ba at d5. (K,L) Dashed blue lines are at the level of the eyes. Jaw extension defects are present in ‘crispants’ (K), whereas the jaws of GMS:kif5ba transgenic larvae are normal (L). (M) Quantification of jaw and swim bladder (SB) phenotypes. |
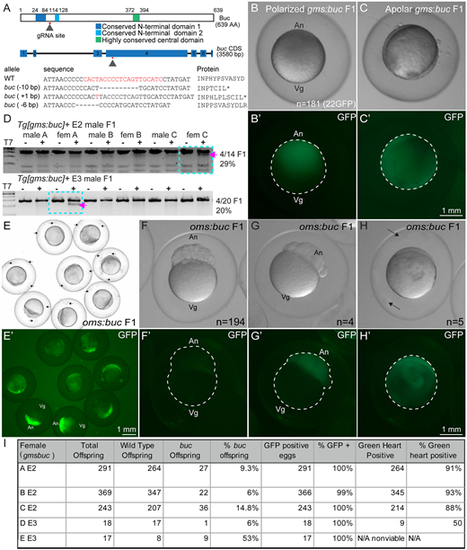
(A) Schematic depicting the site targeted in buc and representative mutant alleles. (B-C′) F1 progeny of F0 female transgenic for GMS:buc are (B,B′) polarized or (C,C′) lack polarity. (D) Representative T7 endonuclease assays to detect buc mutations. Mutagenesis frequencies for F1 progeny of two founder males. (E-H) Bright-field images and (E′-H′) maternal GFP expression in (E,E′) progeny of an OMS:buc F1 female and (F-H′) progeny of OMS:buc F0 female. (F,F′) GFP− embryo with normal polarity. (G,G′) GFP+ embryo with normal polarity. (H,H′) GFP+ apolar embryo. (I) Table shows transmission frequency and phenotype penetrance of GMS:buc F1 progeny. |