
- Title
-
Caffeine Inhibits Direct and Indirect Angiogenesis in Zebrafish Embryos
- Authors
- Basnet, R.M., Zizioli, D., Muscò, A., Finazzi, D., Sigala, S., Rossini, E., Tobia, C., Guerra, J., Presta, M., Memo, M.
- Source
- Full text @ Int. J. Mol. Sci.

Caffeine affects ISVs’ development. (A) Representative, lateral-view pictures of Tg(kdrl:EGFP) control and caffeine-treated embryos at 48 hpf. Magnification 32×. (B) Enlargement of the tail of embryos shown in A. Magnification 63×. White asterisks point to the ISVs considered for the measurement. (C,D). The graphs represent the mean values obtained for ISVs length and width measurements, respectively, both in control and treated embryos. Three replicates were performed, with 10 embryos per group. *** p < 0.0005. |

Caffeine affects the number of intercapillary spaces in the CVP. (A) Representative pictures showing the CVP of Tg(kdrl:EGFP) control and treated embryos at 48 hpf. Magnification 32×. Asterisks point to the intercapillary spaces. (B) The bar diagram in the panel shows the average number of intercapillary spaces in control and caffeine (100 and 150 mg/L)-treated embryos. Three biological replicates were performed, with 10 embryos per group. Statistical analysis was performed with GraphPad Prism software, version 8.3.0 (GraphPad Software, Inc., La Jolla, CA, USA). * p < 0.05, **** p < 0.0005, when compared with the control group. |

Caffeine-treated embryos display a reduced expression of fli1 and cad5. Representative lateral views of the WISH for fli1 (A) and cadh5 (B) probes, performed in 28 hpf embryos raised in sterile water (control) or treated with caffeine 100 mg/L. Magnification 32×. Ratios at the bottom right part of each picture specify the number of embryos showing the same staining pattern, compared to the total number of embryos used for each experiment (n = 15). (C,D) The bar diagrams show the quantification of the colorimetric signal in control and caffeine-treated embryos. The expression of fli1 and cadh5 was significantly reduced in the caffeine-treated embryos. For cadh5, two replicates were performed (n = 15), while for fli1, the experiments were conducted in triplicate (n = 15). * p < 0.05, ** p < 0.005, when compared with control group. |
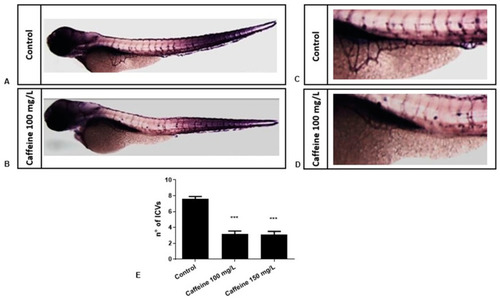
Caffeine exposure decreases the number of interconnecting vessels in the SIVP. (A,B) The panels show representative pictures of AP assay performed in control and treated embryos at 72 hpf (magnification 32×), with an enlargement of the SIVP (magnification 63×) in C and D. (E) The bar diagram shows the average number of SIV branches in zebrafish embryos at 72 hpf (three replicates were performed, n = 15 for each group). Statistical analysis was performed with GraphPad Prism software. *** p < 0.001, when compared with the control group. |

Evaluation of the effects of caffeine treatment on FGF2-microinjected embryos. ( |
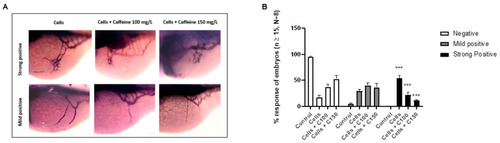
Microinjection of 3F2T cells in perivitelline space and subsequent treatment with caffeine. ( |