
- Title
-
Interspecies Behavioral Variability of Medaka Fish Assessed by Comparative Phenomics
- Authors
- Audira, G., Siregar, P., Chen, K.H., Roldan, M.J.M., Huang, J.C., Lai, H.T., Hsiao, C.D.
- Source
- Full text @ Int. J. Mol. Sci.
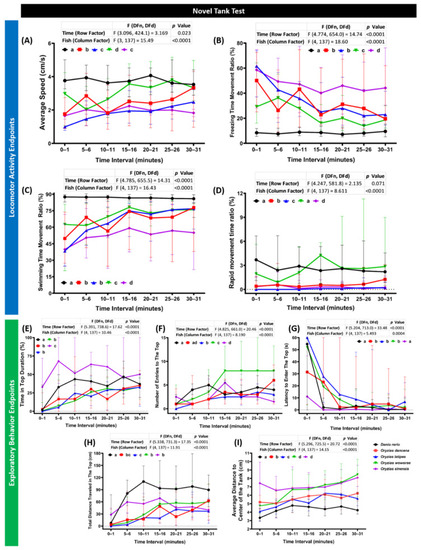
Novel tank behavior endpoints comparison between each tested fish species (medaka and zebrafish). (A) Average speed, (B) freezing time movement ratio, (C) swimming time movement ratio, (D) rapid movement time ratio, (E) time in top duration, (F) number of entries to the top, (G) latency to enter the top, (H) total distance traveled in the top, and (I) average distance to the center of the tank were analyzed. The data were analyzed by the two-way ANOVA test with Geisser–Greenhouse correction continued with uncorrected Fisher’s LSD test. Different letters (a, b, c, d) on the error bars represent a significant statistical difference (p < 0.05). The data are expressed as the median with interquartile range (n = 30 for zebrafish, O. dancena, O. latipes, and O. woworae; n = 22 for O. sinensis). |
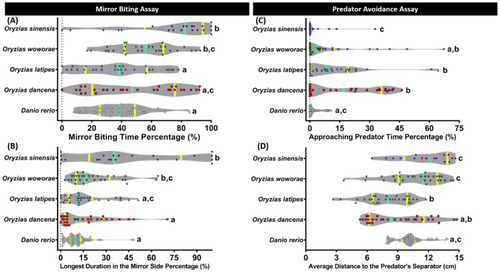
Mirror biting and predator avoidance behavior comparisons between each tested fish species (medaka and zebrafish). (A) Mirror biting time percentage and (B) longest duration on the mirror side percentage were analyzed in the mirror biting assay (n = 30 for zebrafish, O. dancena, O. latipes, and O. woworae; n = 22 for O. sinensis). (C) Approaching predator time percentage and (D) average distance to the predator’s separator were analyzed in the predator avoidance assay (n = 30 for zebrafish, O. dancena, O. latipes, and O. woworae; n = 16 for O. sinensis). The data were analyzed by the Kruskal–Wallis test continued with uncorrected Dunn’s test. Different letters (a, b, c) on the error bars represent a significant statistical difference (p < 0.05). The violin plot’s median and interquartile were labeled with the bold line colored with cyan and yellow. |
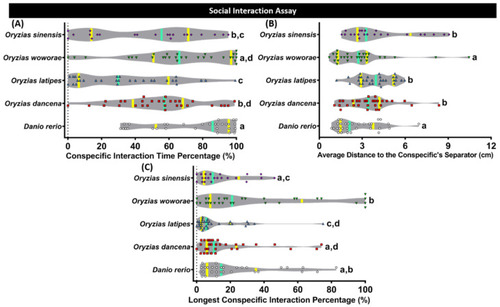
Conspecific social interaction behavior comparisons between each tested fish species (medaka and zebrafish). (A) Conspecific interaction time percentage, (B) average distance to the conspecifics separator, and (C) longest conspecific interaction percentage were analyzed. The data were analyzed by the Kruskal–Wallis test continued with uncorrected Dunn’s test. Different letters (a, b, c, d) on the error bars represent a significant statistical difference (p < 0.05) (n = 30 for zebrafish, O. dancena, O. latipes, and O. woworae; n = 21 for O. sinensis). The median and interquartile for the violin plot were labeled with the bold line colored with cyan and yellow. |
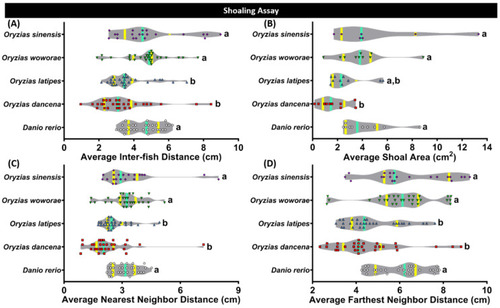
Shoaling behavior comparisons between each tested fish species (medaka and zebrafish). (A) Average inter-fish distance, (B) average shoal area, (C) average nearest neighbor distance, and (D) average farthest neighbor distance were analyzed. Groups of three fish were tested for shoaling behavior. The data were analyzed by the Kruskal–Wallis test continued with uncorrected Dunn’s test. Different letters (a, b) on the error bars represent a significant statistical difference (p < 0.05) (n = 30 for zebrafish, O. dancena, O. latipes, and O. woworae; n = 21 for O. sinensis). The median and interquartile for the violin plot were labeled with the bold line colored with cyan and yellow. |
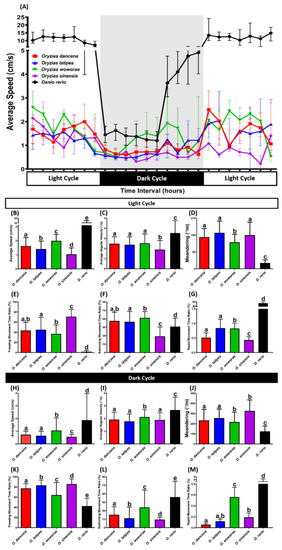
The circadian locomotor activity rhythm of medaka fish and AB strain zebrafish as the outgroup. (A) Comparison of the average speed between each tested fish species (medaka and zebrafish) during the day and night cycles. Comparisons of (B,H) average speed, (C,I) average angular velocity, (D,J) meandering, (E,K) freezing movement time ratio, (F,L) swimming movement time ratio, and (G,M) rapid movement time ratio between each tested fish species (medaka and zebrafish) in the day and night cycles, respectively. Data are presented as median with interquartile range, except for (G,M), which are presented as mean with a 95% confidence interval (CI) since some median of the data in those figures are 0. Data were analyzed by Kruskal–Wallis test continued with uncorrected Dunn’s test. Different letters (a, b, c, d, e) on the error bars represent a significant statistical difference (p < 0.05) (n = 18 for O. dancena, O. latipes, O. woworae, and D. rerio; n = 12 for O. sinensis). |
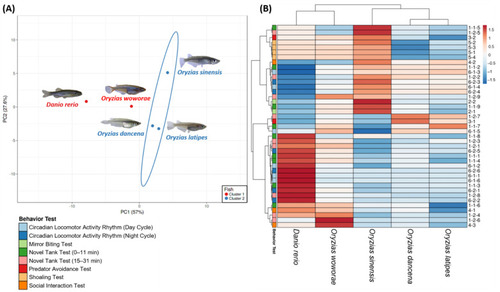
(A) Principal component analysis and (B) hierarchical clustering analysis of multiple behavior endpoints in several different medaka species and zebrafish. In (A), two major clusters from hierarchical clustering analysis results were marked with the red color (1st cluster) and blue (2nd cluster) circle. The behavioral data from zebrafish were also included as the outgroup to conduct a more in-depth study about their behavior differences pattern. |
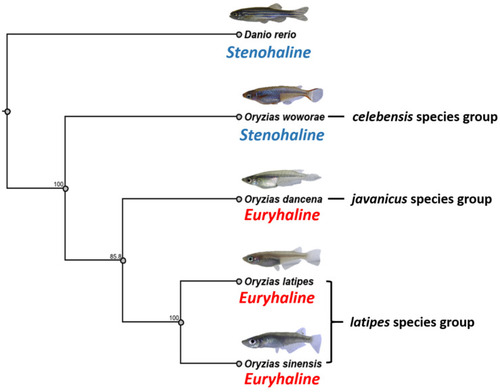
Phylogenetic relationships among four Oryzias species and Danio rerio inferred from the datasets of NADH dehydrogenase subunit 2 gene (nd2). The phylogenetic relationships were analyzed by the maximum likelihood method. The numbers beside the branches indicate the bootstrap values. Based on the prior publication by Murata et al. (2019), O. latipes and O. sinensis genetically belong to the latipes species group while O. dancena and O. woworae belong to javanicus and celebensis species groups, respectively. |