
Figure 3
- ID
- ZDB-FIG-210617-89
- Publication
- Audira et al., 2021 - Interspecies Behavioral Variability of Medaka Fish Assessed by Comparative Phenomics
- Other Figures
- All Figure Page
- Back to All Figure Page
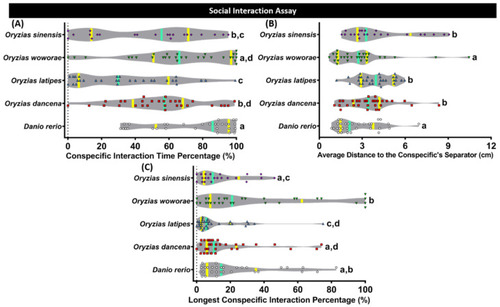
Conspecific social interaction behavior comparisons between each tested fish species (medaka and zebrafish). (A) Conspecific interaction time percentage, (B) average distance to the conspecifics separator, and (C) longest conspecific interaction percentage were analyzed. The data were analyzed by the Kruskal–Wallis test continued with uncorrected Dunn’s test. Different letters (a, b, c, d) on the error bars represent a significant statistical difference (p < 0.05) (n = 30 for zebrafish, O. dancena, O. latipes, and O. woworae; n = 21 for O. sinensis). The median and interquartile for the violin plot were labeled with the bold line colored with cyan and yellow. |