
|
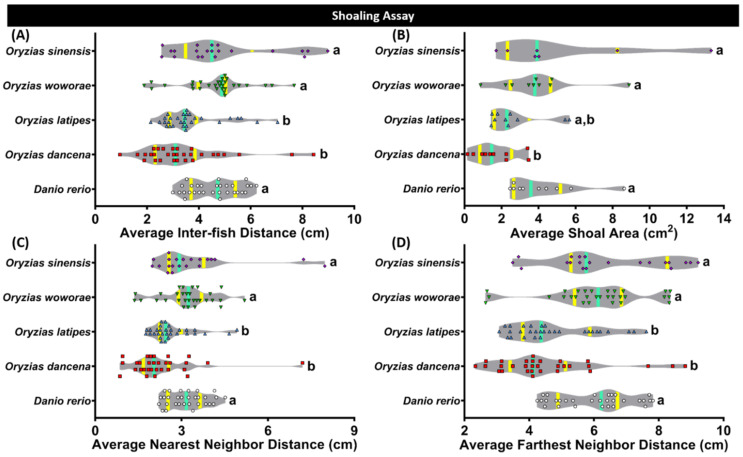
Figure 4 Shoaling behavior comparisons between each tested fish species (medaka and zebrafish). (A) Average inter-fish distance, (B) average shoal area, (C) average nearest neighbor distance, and (D) average farthest neighbor distance were analyzed. Groups of three fish were tested for shoaling behavior. The data were analyzed by the Kruskal–Wallis test continued with uncorrected Dunn’s test. Different letters (a, b) on the error bars represent a significant statistical difference (p < 0.05) (n = 30 for zebrafish, O. dancena, O. latipes, and O. woworae; n = 21 for O. sinensis). The median and interquartile for the violin plot were labeled with the bold line colored with cyan and yellow.