
- Title
-
An Engineered sgsh Mutant Zebrafish Recapitulates Molecular and Behavioural Pathobiology of Sanfilippo Syndrome A/MPS IIIA
- Authors
- Douek, A.M., Amiri Khabooshan, M., Henry, J., Stamatis, S.A., Kreuder, F., Ramm, G., Änkö, M.L., Wlodkowic, D., Kaslin, J.
- Source
- Full text @ Int. J. Mol. Sci.
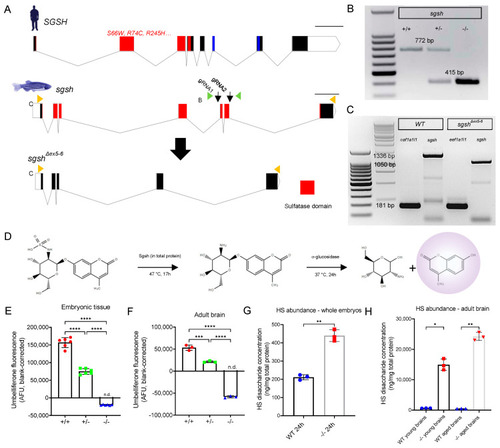
Generation and biochemical validation of the sgshΔex5−6 mutant zebrafish. (A) Exon-intron diagram representations of wild type human SGSH, wild type zebrafish sgsh, and the zebrafish sgshΔex5−6 allele. Exons comprising sulfatase domain highlighted in red; exons comprising sulfatase-associated Domain of Unknown Function DUF4976 highlighted in blue. Downwards-facing arrows indicate gRNA target sites. Orange arrowheads reflect primer positions for RT-PCR; green arrowheads reflect primer positions for genotyping PCR. Scale bar is 1 kilobase. (B) Genotyping PCR of wild type (+/+), heterozygous (+/−) and homozygous sgshΔex5−6 (−/−) alleles. Wild type sgsh produces a band at 772 bp, while sgshΔex5−6 produces a band at 415 bp. (C) RT-PCR amplicons of sgsh in RNA from wild type (+/+) or homozygous sgshΔex5−6 (−/−) zebrafish embryos at 24 hpf using primers located in the first and last exons of sgsh. Wild type sgsh produces a prominent band at 1336 bp, while sgshΔex5−6 produces a band at 1050 bp corresponding to loss of exons 5 and 6. eef1a1l1 (amplicon size 181 bp) included for both genotypes as housekeeping control. (D) Overview of Sgsh enzyme activity assay. 4MU-αGlcNS is desulfated by Sgsh in total protein, then glucosamine is hydrolysed from UV-fluorescent 4MU by bacterial α-glucosidase. (E) Enzyme activity in wild type (+/+), sgshΔex5−6 heterozygous (+/−) and homozygous (−/−) whole embryos (n = 100 embryos per sample, 6 samples per group). (F) Enzyme activity in adult brain (n = 3 brains per sample, 3 samples per group) for each genotype. Negative arbitrary fluorescence values observed in sgshΔex5−6 homozygous samples result from absorbance of UV excitation wavelengths by protein input and blank correction. Data in (E,F) are presented as mean ± SEM and tested via ordinary one-way ANOVA with Tukey’s multiple comparisons test; **** p < 0.0001 and *** p = 0.0001. (G) HS disaccharide abundance in whole 24 hpf embryos from either wild type or sgshΔex5−6 genotypes as determined by LC-MS/MS (n = 50 embryos per sample, n = 3 samples per group). Data presented as mean ± SEM and tested by Welch’s t-test. ** p = 0.0021. (H) HS abundance in young (6-month-old) or aged (18-month-old) brains from either wild type or sgshΔex5−6 genotypes determined by LC-MS/MS (n = 3 brains per sample, n = 3 samples per group). Data presented as mean ± SEM and tested by Brown-Forsythe and Welch ANOVA with Dunnett’s T3 multiple comparisons test. * p = 0.0171, ** p = 0.0031. |
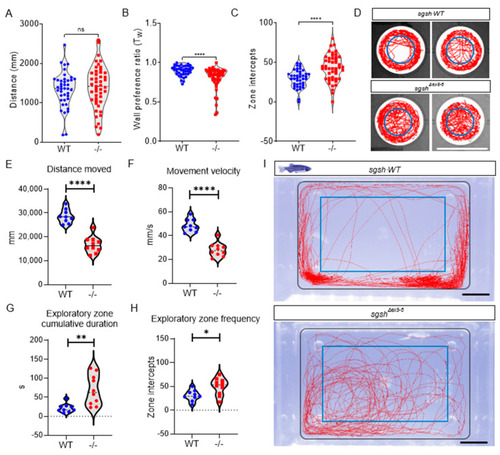
sgshΔex5−6 zebrafish exhibit progressive behavioural abnormalities. Behavioural tracking of 5 dpf wild type and sgshΔex5−6 homozygous larvae, examining (A) cumulative distance travelled, (B) wall preference ratio (Tw), and (C) zone intercepts to and from the central arena reflecting exploration behaviour. In (A–C) each point represents an individual larva. (D) Representative movement traces of single larval movement in the imaging arena throughout the recording period for both wild type and sgshΔex5−6 genotypes. Central blue circle indicates region for zone intercept calculations. Scale bar 15 mm. (E) Cumulative distance travelled by adult (6-month-old) wild type and sgshΔex5−6 zebrafish. (F) Average movement velocity between adult wild type and sgshΔex5−6 zebrafish. (G) Cumulative time spent in exploratory zone between adult wild type and sgshΔex5−6 zebrafish. (H) Frequency of interception with exploratory zone boundaries between adult wild type and sgshΔex5−6 zebrafish. Data in (A–C) are presented as mean ± SEM and tested by Mann-Whitney U test, and in (E–H) by unpaired t-test. In all samples **** p < 0.0001 and n.s. p > 0.05; in G ** p = 0.0029 and in H * p = 0.0146. (I) Representative movement traces of single adult movement in the imaging arena throughout the recording period for both wild type and sgshΔex5−6 genotypes. Inner blue rectangle indicates region for exploratory zone calculations. Scale bars 1 cm. |

Cellular pathological features of MPS IIIA are recapitulated in sgshΔex5−6 zebrafish. Single-plane images of LysoTracker Red DND-99 live staining of lysosomes (arrowheads) and autophagosomes (arrows) in the telencephalon of larval zebrafish of either wild type (A) or sgshΔex5−6 (B) genotypes at 7 dpf. Scale bar = 20 µm. (C) Quantification of LysoTracker+ lysosomes in dorsal telencephalic grey matter between wild type and sgshΔex5−6 larvae. (D) Quantification of LysoTracker+ autophagosomes in dorsal telencephalic grey matter between wild type and sgshΔex5−6 larvae. Each point represents a single telencephalon. Data in (C–D) presented as mean ± SEM and tested by unpaired t-test; *** p = 0.0001 and **** p < 0.0001. (E–G) Ultrastructural examination of cerebellar axons in aged (18-month-old) wild type brain. Scale bars 200 nm in (E), 5 µm in (F) and 1 µm in (G). Intracellular (H) and axonal (I–J) lysosome (arrowheads) and autophagosome (arrows) overabundance in cerebellar neurons from aged sgshΔex5−6 brain. Scale bars 500 nm in (H), 2 µm in (I) and 1 µm in (J). (K) Detection of apoptotic objects as labelled by the Tg(-3.5ubb:SECHsa.ANXA5-mVenus) transgene in 7 dpf wild type and sgshΔex5−6 larval brains; scale bar 50 µm. Insets are boxed region in each panel. (L) Quantification of ANXA5-mVenus apoptotic objects in 7 dpf wild type and sgshΔex5−6 larval brains. Each point represents a single brain. Data presented as mean ± SEM and tested by Mann-Whitney U test; *** p = 0.0003. |
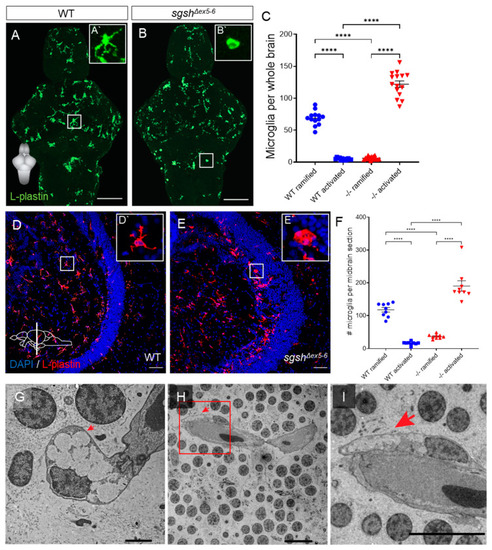
Microglial activation and neuroinflammation in the larval and adult sgshΔex5−6 CNS. (A,B) L-plastin immunostaining of microglia in wild type and sgshΔex5−6 7 dpf larval brains. Scale bar = 50 µm. (A`) Zoom of boxed region in (A) showing a representative ramified microglial cell in the larval zebrafish brain. (B`) Zoom of boxed region in (B) showing representative amoeboid microglial cell in the larval zebrafish brain. (C) Quantification of L-plastin+ microglial morphology and abundance in wild type or sgshΔex5−6 7 dpf brains. Each point represents a single brain. Data presented as mean ± SEM and tested by ordinary one-way ANOVA with Tukey’s multiple comparisons test; **** p < 0.0001. (D–E) L-plastin immunostaining of microglia in midbrain sections of adult wild type and sgshΔex5−6 zebrafish, scale bar = 50 µm. (D`) Zoom of boxed region in (D) showing representative ramified microglial cell in the adult zebrafish midbrain. (E`) Zoom of boxed region in (E) showing representative amoeboid microglial cell in the adult zebrafish midbrain. (F) Quantification of L-plastin+ microglial morphology and abundance in adult wild type and sgshΔex5−6 midbrain sections. Each point represents a single section, n = 3 sections of approximately equal level quantified per brain. Data presented as mean ± SEM and tested by ordinary one-way ANOVA with Tukey’s multiple comparisons test; **** p < 0.0001. (G–I) Detection by TEM of perivascular microglia with activated morphology with large, electron-lucent intracellular vacuoles (arrows) in the midbrain of 18-month-old sgshΔex5−6 zebrafish. Scale bars 2 µm in (G), 100 µm in (H,I). |
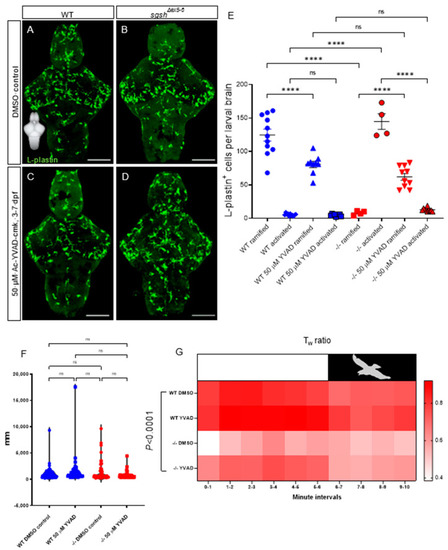
CNS neuroinflammation in sgshΔex5−6 larvae is corrected by continuous pharmacological Caspase-1 blockade. (A,B) L-plastin immunostaining of microglia in 7 dpf wild type and sgshΔex5−6 brains from larvae continuously treated from 3–7 dpf with 0.1% DMSO as control. (C,D) L-plastin immunostaining of microglia in 7 dpf wild type and sgshΔex5−6 brains from larvae continuously treated from 3–7 dpf with 50 µM Ac-YVAD-cmk Caspase-1 inhibitor. Scale bars 50 µm. (E) Quantification of L-plastin+ microglial morphology and abundance following treatment with either 50 µM Ac-YVAD-cmk or 0.1% DMSO in wild type and sgshΔex5−6 larval brains at 7 dpf. Each point represents a single brain. Data presented as mean ± SEM and tested by ordinary one-way ANOVA with Tukey’s multiple comparisons test; **** p < 0.0001, n.s. p > 0.05. (F) Neither YVAD nor DMSO exposure significantly alters basal movement (cumulative distance travelled, mm, in constant illumination) in either wild type or sgshΔex5−6 7 dpf larvae. Data presented as mean ± SEM and tested by one-way ANOVA with Tukey’s multiple comparisons test; n.s. p > 0.05. (G) Chronic YVAD administration to sgshΔex5−6 partially rescues impaired thigmotaxis behaviours under standard conditions (white boxed region, representing constant levels of light), but does not attenuate the impaired escape response in response to sudden threat conditions (black boxed region, representing sudden switching off of light and resulting darkness). Data presented as heat map reflecting relative mean Tw (wall preference ratio) metric at specific time point of sample recording. Data were analysed by two-way ANOVA with stacked matching, where sphericity of variances was not assumed and α = 0.05. The treatment condition was found to represent 47.43% of variation in the dataset, p < 0.0001. Each group represents mean values of 18 replicate trials per each condition. |