
|
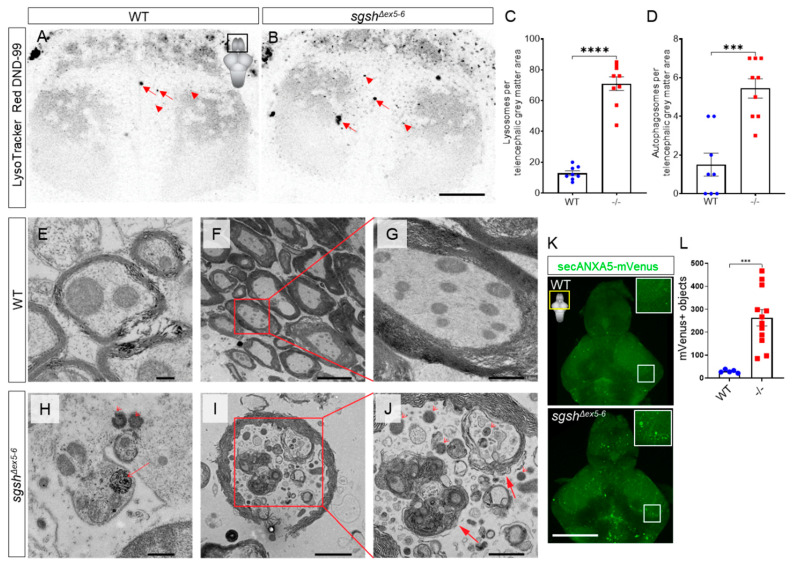
Figure 3 Cellular pathological features of MPS IIIA are recapitulated in sgshΔex5−6 zebrafish. Single-plane images of LysoTracker Red DND-99 live staining of lysosomes (arrowheads) and autophagosomes (arrows) in the telencephalon of larval zebrafish of either wild type (A) or sgshΔex5−6 (B) genotypes at 7 dpf. Scale bar = 20 µm. (C) Quantification of LysoTracker+ lysosomes in dorsal telencephalic grey matter between wild type and sgshΔex5−6 larvae. (D) Quantification of LysoTracker+ autophagosomes in dorsal telencephalic grey matter between wild type and sgshΔex5−6 larvae. Each point represents a single telencephalon. Data in (C–D) presented as mean ± SEM and tested by unpaired t-test; *** p = 0.0001 and **** p < 0.0001. (E–G) Ultrastructural examination of cerebellar axons in aged (18-month-old) wild type brain. Scale bars 200 nm in (E), 5 µm in (F) and 1 µm in (G). Intracellular (H) and axonal (I–J) lysosome (arrowheads) and autophagosome (arrows) overabundance in cerebellar neurons from aged sgshΔex5−6 brain. Scale bars 500 nm in (H), 2 µm in (I) and 1 µm in (J). (K) Detection of apoptotic objects as labelled by the Tg(-3.5ubb:SECHsa.ANXA5-mVenus) transgene in 7 dpf wild type and sgshΔex5−6 larval brains; scale bar 50 µm. Insets are boxed region in each panel. (L) Quantification of ANXA5-mVenus apoptotic objects in 7 dpf wild type and sgshΔex5−6 larval brains. Each point represents a single brain. Data presented as mean ± SEM and tested by Mann-Whitney U test; *** p = 0.0003.