
- Title
-
Proapoptotic Bad Involved in Brain Development, When Severely Defected, Induces Dramatic Malformation in Zebrafish
- Authors
- Hung, J.C., Wu, J.L., Hong, J.R.
- Source
- Full text @ Int. J. Mol. Sci.
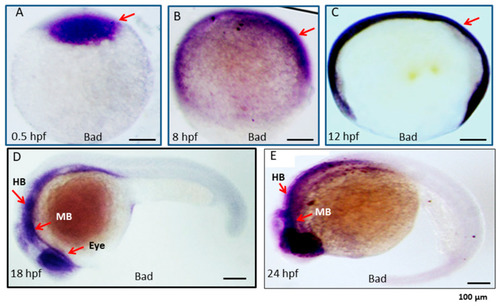
Expression pattern of the proapoptotic gene Bad during embryonic development in zebrafish. Bad expression from early to late developmental stages, as detected by in situ antisense RNA hybridization. Bad was visualized by blue staining. Lateral views of embryos are shown in panels (A–E). (A) One-cell stage (half-hour). Bad is expressed in all cells examined. (B,C) At 8 and 12 hpf, Bad is expressed throughout the embryo. (D) At 18 hpf, Bad is expressed and concentrated within the midbrain (MB) and hindbrain (HB) regions (indicated by an arrow) and the eye region. (E) At 24 hpf, Bad is expressed in the midbrain (MB) and hindbrain (HB) regions (indicated by arrows). Scale bars = 100 µm. |
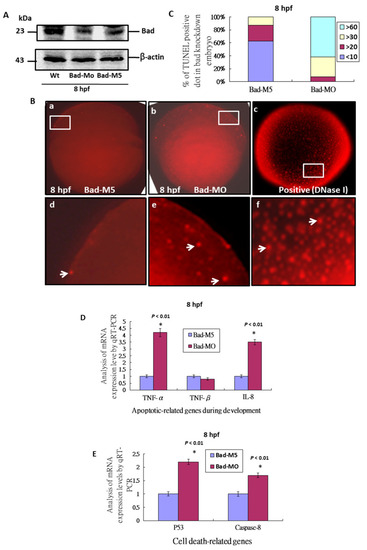
Bad knockdown can enhance p53/caspase-8 death signaling. (A) Identification of Bad knockdown by specific morpholino (Bad-MO) at 8 hpf via Western blot analysis. (B,C) TUNEL-positive spot staining (indicated by arrows) at 8 hpf with Bad knockdown by Bad-MO. The Bad-MO group shows more signal than the Bad-M5 (Control group). TUNEL-positive spots within the embryo were counted and are shown in (C). The DNase I treatment group was used as a positive control. (D,E) Analysis of apoptotic-related genes during development and cell-death-related genes by qRT-PCR at 8 hpf with Bad knockdown. All data were analyzed using either paired or unpaired Student’s t-tests, as appropriate. TUNEL-positive cells under the fluorescence microscope are considered apoptotic. EXPRESSION / LABELING:
PHENOTYPE:
|
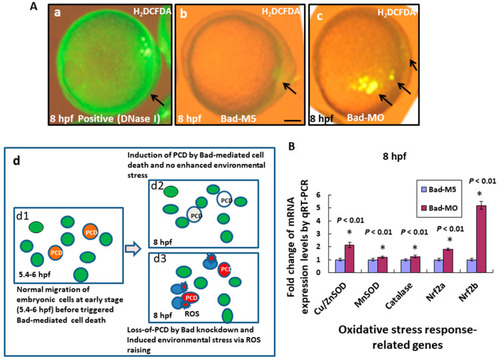
Bad knockdown can enhance ROS production and induces oxidative stress at early embryonic stage. (A) Loss-of-Bad-mediated cell death can enhance ROS production. ROS production was assayed using H2DCFDA in embryos with Bad knockdown at 8 hpf. The green fluorescent signal, reflecting ROS, is indicated by arrows. Loss of PCD can enhance environmental stress in blue cells; (Ad3) due to ROS production. Bars indicate 100 μm. (B) Analysis of oxidative stress response-related genes by qRT-PCR at 8 hpf with Bad knockdown. All data were analyzed using either paired or unpaired Student’s t-tests, as appropriate. EXPRESSION / LABELING:
PHENOTYPE:
|
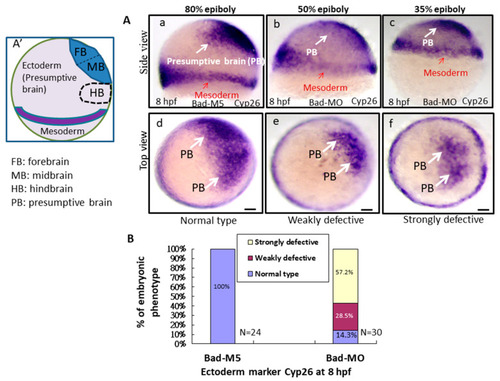
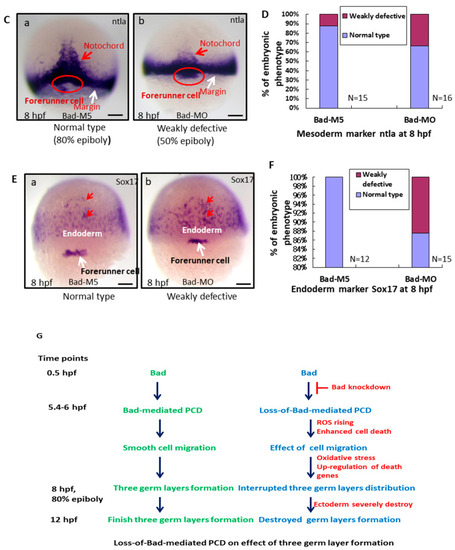
Bad-mediated PCD can regulate cell movement and cells in three-germ-layer targeting to destination sites, as shown via in situ hybridization. Morphological analysis of embryos injected with either 25 ng of control-MO (Bad-M5) or Bad-MO and examined at 8 hpf after ectoderm, mesoderm, and endoderm tissues were stained with cyp26, ntla, and sox17, respectively, via in situ hybridization. (A) The embryos are stained with cyp26 (side view, panels a–c; top view, panels d–f), with the presumptive brain (PB) indicated by white arrows and the mesoderm by red arrows. (B) Quantification of loss-of-Bad-induced PCD effects on ectoderm migration in connection to abnormal brain development at 24 hpf. All data were analyzed using either paired or unpaired Student’s t-tests, as appropriate. p < 0.01. (C) Bad knockdown can induce mild mesoderm defects, as shown by probing with the mesoderm marker ntla gene. Panels a (Bad-M5 group) and b (Bad-MO group): notochord profile indicated by red arrows; margin pattern indicated by white arrow; and forerunner cell indicated by red circle. Bars indicate 100 μm. (D) Quantification of mild loss-of-Bad-induced PCD effects on mesoderm pattern. All data were analyzed using either paired or unpaired Student’s t-tests, as appropriate. p < 0.01. (E) Bad knockdown can induce very mild endoderm defects, as shown by probing with the endoderm marker sox17 gene. Panels a,b, endoderm signal indicated by red arrows and forerunner cell by white arrow. The defect ratio was counted and is shown in (F). All data were analyzed using either paired or unpaired Student’s t-tests as appropriate. p < 0.01. (G) Sketch illustrating how loss-of-Bad-mediated PCD affects smooth cell migration during the formation of the three germ layers at 8 hpf: environmental stress in the form of ROS production was increased, and enhanced cell death further interrupted brain development at a later developmental stage. PHENOTYPE:
|
Bad-mediated PCD can regulate cell movement and cells in three-germ-layer targeting to destination sites, as shown via in situ hybridization. Morphological analysis of embryos injected with either 25 ng of control-MO (Bad-M5) or Bad-MO and examined at 8 hpf after ectoderm, mesoderm, and endoderm tissues were stained with cyp26, ntla, and sox17, respectively, via in situ hybridization. (A) The embryos are stained with cyp26 (side view, panels a–c; top view, panels d–f), with the presumptive brain (PB) indicated by white arrows and the mesoderm by red arrows. (B) Quantification of loss-of-Bad-induced PCD effects on ectoderm migration in connection to abnormal brain development at 24 hpf. All data were analyzed using either paired or unpaired Student’s t-tests, as appropriate. p < 0.01. (C) Bad knockdown can induce mild mesoderm defects, as shown by probing with the mesoderm marker ntla gene. Panels a (Bad-M5 group) and b (Bad-MO group): notochord profile indicated by red arrows; margin pattern indicated by white arrow; and forerunner cell indicated by red circle. Bars indicate 100 μm. (D) Quantification of mild loss-of-Bad-induced PCD effects on mesoderm pattern. All data were analyzed using either paired or unpaired Student’s t-tests, as appropriate. p < 0.01. (E) Bad knockdown can induce very mild endoderm defects, as shown by probing with the endoderm marker sox17 gene. Panels a,b, endoderm signal indicated by red arrows and forerunner cell by white arrow. The defect ratio was counted and is shown in (F). All data were analyzed using either paired or unpaired Student’s t-tests as appropriate. p < 0.01. (G) Sketch illustrating how loss-of-Bad-mediated PCD affects smooth cell migration during the formation of the three germ layers at 8 hpf: environmental stress in the form of ROS production was increased, and enhanced cell death further interrupted brain development at a later developmental stage. |
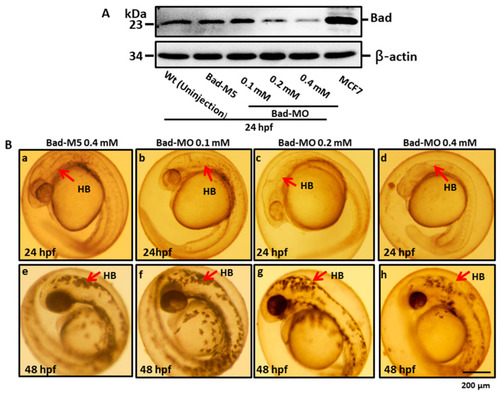
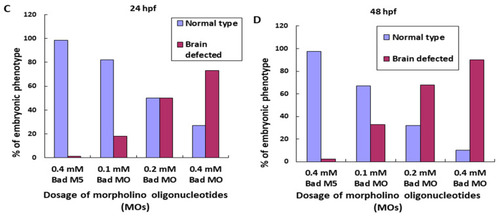
BH3-only proapoptotic gene Bad can regulate brain development between 24 and 48 hpf. (A) Dosage dependence of Bad knockdown (lanes 3–5 for 0.1, 0.2, and 0.4 mM, respectively) shown by Western blot analysis and compared with the uninjected group (lane 1) and the normal control Bad-M5 group (lane 2). The positive control MCF7 cell lysate is shown in lane 6. (B–D) Identification of morphological phenotype defects in the brain during Bad knockdown with dosage response. Each one-cell-stage embryo was injected with either 0.4 mM of control-MO or 0.1, 0.2, or 0.4 mM of Bad-MO. At 24 and 48 hpf, embryos were observed under a microscope. Phase-contrast images of the control-MO-injected (Ba,e) and Bad-MO [lower dose (0.1 mM)-injected; (Bb,f)] embryos show normal brain development. However, the embryos injected with higher doses of Bad-MO embryos show abnormal brain development ((Bc,g), 0.2 mM; (Bd,h) 0.4 mM at 24 and 48 hpf, respectively) in the hindbrain (HB), indicated by arrows. The defect rates (N, up to 120 embryos) were counted and are shown in Figure 3C,D for 24 and 48 hpf, respectively, revealing a statistically significant difference. |
BH3-only proapoptotic gene Bad can regulate brain development between 24 and 48 hpf. (A) Dosage dependence of Bad knockdown (lanes 3–5 for 0.1, 0.2, and 0.4 mM, respectively) shown by Western blot analysis and compared with the uninjected group (lane 1) and the normal control Bad-M5 group (lane 2). The positive control MCF7 cell lysate is shown in lane 6. (B–D) Identification of morphological phenotype defects in the brain during Bad knockdown with dosage response. Each one-cell-stage embryo was injected with either 0.4 mM of control-MO or 0.1, 0.2, or 0.4 mM of Bad-MO. At 24 and 48 hpf, embryos were observed under a microscope. Phase-contrast images of the control-MO-injected (Ba,e) and Bad-MO [lower dose (0.1 mM)-injected; (Bb,f)] embryos show normal brain development. However, the embryos injected with higher doses of Bad-MO embryos show abnormal brain development ((Bc,g), 0.2 mM; (Bd,h) 0.4 mM at 24 and 48 hpf, respectively) in the hindbrain (HB), indicated by arrows. The defect rates (N, up to 120 embryos) were counted and are shown in Figure 3C,D for 24 and 48 hpf, respectively, revealing a statistically significant difference. |
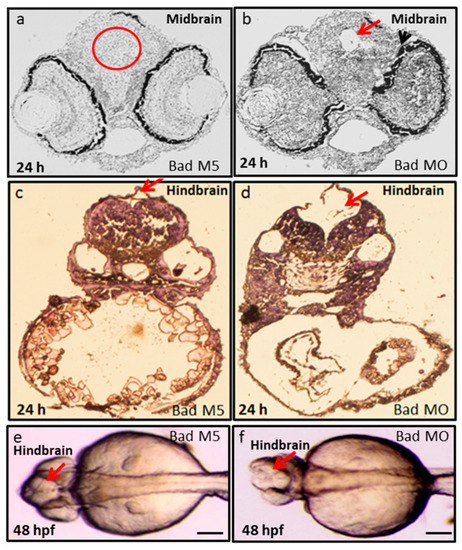
Bad loss can produce brain defects and brain malfunction between 24 and 48 hpf. Dissection and observation of brain development in loss-of-Bad-mediated PCD embryos at 24 and 48 hpf. HE staining to show midbrain and hindbrain development in the Bad-M5 group in panels |
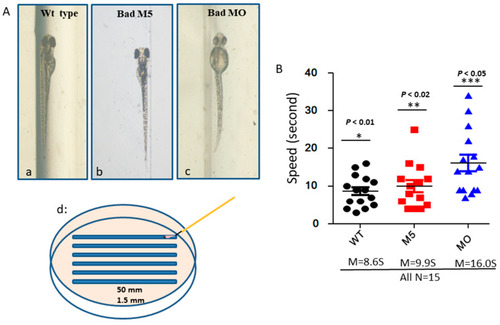
Identification of brain functions through monitoring of swimming behavior at 72 hpf. ( PHENOTYPE:
|
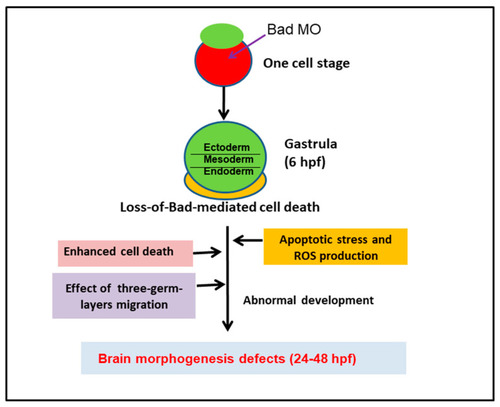
Diagram of Bad involvement in committed PCD and brain development from 0.5 to 72 hpf, including both first- (5.4–12 hpf) and second-round PCD (after 12 hpf). The early PCD is essential for early smooth-cell migration and for the formation of the three germ layers in later development, which is connected to second-round PCD for tissue and organ development. |