
- Title
-
Generation and Molecular Characterization of Transient tet1/2/3 Zebrafish Knockouts
- Authors
- Ross, S.E., Bogdanovic, O.
- Source
- Full text @ Meth. Mol. Biol.
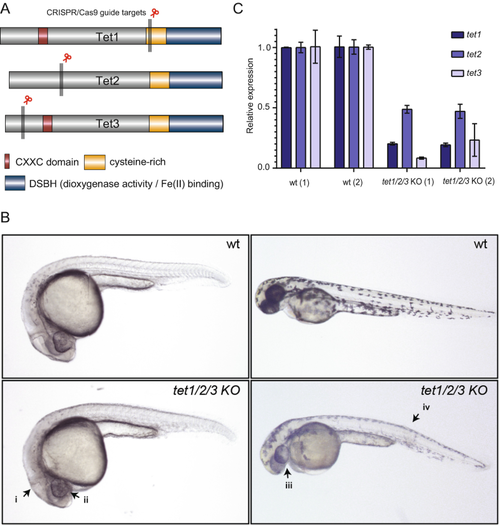
Phenotypes of tet1/2/3 KO F0 zebrafish following CRISPR/Cas9 microinjections. (a) Zebrafish Tet protein structure and guide RNA design. (b) Top left: uninjected 24 hpf zebrafish, bottom left: tet1/2/3 KO injected 24 hpf zebrafish displaying improperly formed midbrain hindbrain boundary (i) and microphthalmia (ii). Top right: uninjected 48 hpf zebrafish; bottom right: tet1/2/3 KO injected 48 hpf zebrafish displaying microphthalmia (iii), altered pigmentation and curved trunk (iv). (c) qPCR quantification of two biological replicates of uninjected wild type (wt) and injected (tet1/2/3 KO) F0 zebrafish. Each gene is tested in triplicate and represented as the mean relative expression to wt. Error bars represent standard deviation |

Quality assessment of RRBS sequence data. (a) Sequence content across all bases from the FASTQ file for read 1 showing enrichment for CGG or TGG trinucleotides at the beginning of read 1. This bias is due to MspI digestion, which creates fragments beginning with CGG nucleotides (methylated state) or TGG (unmethylated state). (b) Sequence duplication level of the FASTQ file for Read 1. This is another hallmark of successful MspI digestion as each DNA molecule should produce identical fragments |
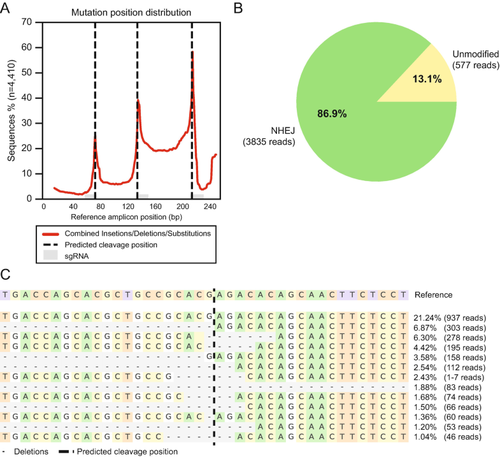
Analysis of genome editing efficiency of tet1 locus from the tet1/2/3 KO amplicon sequencing. (a) Locations of insertions and deletions surrounding the targeted tet1 locus. (b) Quantification of unmodified and non-homologous end joining (NHEJ) events in the tet1 amplicon library. (c) Alleles surrounding the cut site for one of the tet1 gRNAs |
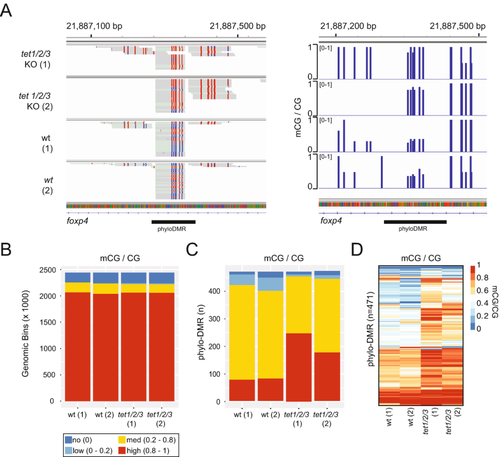
Visualization and analysis of tet1/2/3 KO RRBS data. (a) Left panel: IGV visualization of BAM files in bisulfite mode (CG) over a phylo-DMR (phylotypic stage enhancer) region. Red = methylated cytosine, blue = unmethylated cytosine. Grey boxes represent single reads. Right panel: IGV visualization of BigWig files. Blue bars represent methylation level (mCG/CG). (b) Global mCG/CG levels of two biological replicates of uninjected (wt) and injected (tet1/2/3 KO) 24hpf F0 zebrafish. Methylation values correspond to average mCG/CG level in genomic bins (150 bp). (c) PhyloDMR mCG/CG levels of two biological replicates of uninjected (wt) and injected (tet1/2/3 KO) 24 hpf F0 zebrafish. (d) Heatmap showing locus-specific mCG/CG levels in phyloDMRs |