
- Title
-
The cerebral cavernous malformation pathway controls cardiac development via regulation of endocardial MEKK3 signaling and KLF expression
- Authors
- Zhou, Z., Rawnsley, D.R., Goddard, L.M., Pan, W., Cao, X.J., Jakus, Z., Zheng, H., Yang, J., Arthur, J.S., Whitehead, K.J., Li, D., Zhou, B., Garcia, B.A., Zheng, X., Kahn, M.L.
- Source
- Full text @ Dev. Cell
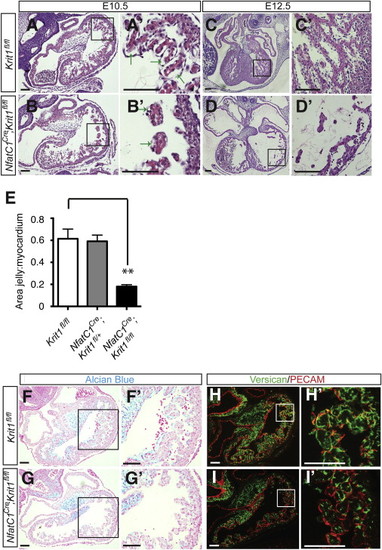
(A–D) Nfatc1Cre;Krit1fl/fl hearts exhibit thinned myocardium and reduced space between endocardial and myocardial cells at E10.5 and E12.5. Arrows indicate the endocardial-myocardial gap. (A′-D′) Higher magnification images of the regions boxed in (A)–(D). (E) Ratio of the area occupied by cardiac jelly to that occupied by myocardium in the trabeculae of E10.5 littermate hearts. N = 3 embryos; nine sections analyzed for each group. ∗∗p < 0.01. Error bars represent SEM. (F and G) Reduced Alcian blue staining in Nfatc1Cre;Krit1fl/fl hearts at E10.5. (F′ and G′) Higher magnification images of the regions boxed in (F) and (G). (H and I) Immunostaining for versican in Nfatc1Cre;Krit1fl/fl and control hearts at E10.5. (H′ and I′) Higher magnification images of the regions boxed in (H) and (I). Scale bars represent 100 μm. |
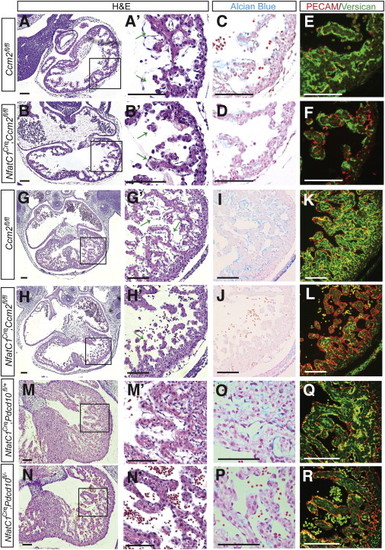
(A and B) Thin myocardium and reduced endocardial-myocardial space in Nfatc1Cre;Ccm2fl/fl hearts at E10.5. (A′ and B′) Higher magnification images of the regions boxed in (A) and (B). (B) Error bars represent SEM. (C and D) Reduced Alcian blue staining in Nfatc1Cre;Ccm2fl/fl hearts at E10.5. Error bars represent SEM. (E and F) Reduced intact versican in in Nfatc1Cre;Ccm2fl/fl hearts at E10.5. (G and H) Thin myocardium and reduced endocardial-myocardial space in Nfatc1Cre;Ccm2fl/fl hearts at E12.5. (G′ and H′) Higher magnification images of the regions boxed in (G) and (H). (I and J) Reduced Alcian blue staining in Nfatc1Cre;Ccm2fl/fl hearts at E12.5. (J) Error bars represent SEM. (K and L) Reduced intact versican in in Nfatc1Cre;Ccm2fl/fl hearts at E12.5. (K) Error bars represent SEM. (M and N) Thin myocardium and reduced endocardial-myocardial space in Nfatc1Cre;Pdcd10fl/fl hearts at E12.5. (M′ and N′) Higher magnification images of the regions boxed in (M) and (N). (O and P) Reduced Alcian blue staining in Nfatc1Cre; Pdcd10fl/fl hearts at E12.5. (Q and R) Reduced intact versican in in Nfatc1Cre; Pdcd10fl/fl hearts at E12.5. Scale bars represent 100 μm. |
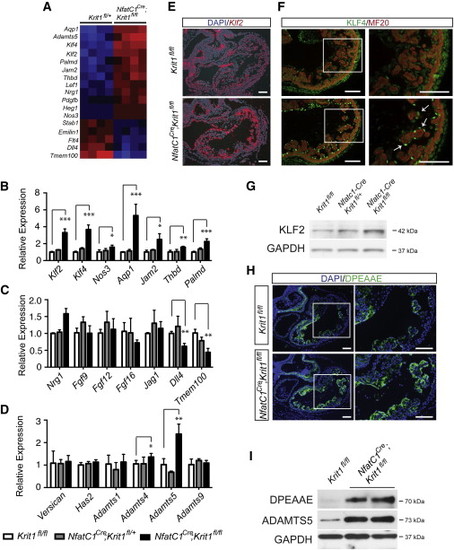
(A) Microarray analysis of mRNA expression in E10.5 Nfatc1Cre;Krit1fl/fl and Krit1fl/+ littermate hearts reveals increased levels of Klf2, Klf4, KLF2 target genes and Adamts5, and reduced levels of Dll4 and Tmem100. N = 4 for both genotypes. (B) qPCR of E10.5 hearts reveals preserved or increased expression of Nrg1 and FGF growth factors following endocardial Krit1 loss. (C) qPCR of E10.5 hearts reveals elevated levels of Klf2 and established KLF2 target genes following endocardial Krit1 loss. (D) qPCR analysis of genes associated with cardiac jelly matrix proteins and matrix-degrading proteases in E10.5 hearts reveals elevated levels of Adamts5 following endocardial Krit1 loss. N = 3 for Krit1fl/fl, N = 4 for Nfatc1Cre;Krit1fl/+, N = 5 for Nfatc1Cre;Krit1fl/fl in (B)–(D). (E) In situ hybridization for Klf2 in E10.5 Nfatc1Cre;Krit1fl/fl and Krit1fl/fl littermate hearts. (F) Immunostaining for KLF4 protein (arrows) and myocardium (MF20) in E10.5 Nfatc1Cre;Krit1fl/fl and Krit1fl/fl littermate hearts. (G) Immunoblot analysis of KLF2 protein in whole E10.5 Nfatc1Cre;Krit1fl/fl and Nfatc1Cre;Krit1fl/+ and Krit1fl/fl littermate hearts. GAPDH is shown as a loading control. (H) Immunostaining using anti-DPEAAE antibody to detect ADAMTS-cleaved versican reveals increased levels in the E10.5 Nfatc1Cre;Krit1fl/fl heart. Boxed regions are shown at higher magnification on the right. (I) Immunoblot analysis of lysate derived from whole E10.5 hearts reveals increased levels of cleaved versican (DPEAAE) and the ADAMTS5 protease with endocardial loss of Krit1. GAPDH is shown as a loading control. Scale bars represent 100 μm. ∗p < 0.05; ∗∗p < 0.01; ∗∗∗p < 0.001. |
(A) Microarray analysis of mRNA expression in E10.5 Nfatc1Cre;Krit1fl/fl and Krit1fl/+ littermate hearts reveals increased levels of Klf2, Klf4, KLF2 target genes and Adamts5, and reduced levels of Dll4 and Tmem100. N = 4 for both genotypes. (B) qPCR of E10.5 hearts reveals preserved or increased expression of Nrg1 and FGF growth factors following endocardial Krit1 loss. (C) qPCR of E10.5 hearts reveals elevated levels of Klf2 and established KLF2 target genes following endocardial Krit1 loss. (D) qPCR analysis of genes associated with cardiac jelly matrix proteins and matrix-degrading proteases in E10.5 hearts reveals elevated levels of Adamts5 following endocardial Krit1 loss. N = 3 for Krit1fl/fl, N = 4 for Nfatc1Cre;Krit1fl/+, N = 5 for Nfatc1Cre;Krit1fl/fl in (B)–(D). (E) In situ hybridization for Klf2 in E10.5 Nfatc1Cre;Krit1fl/fl and Krit1fl/fl littermate hearts. (F) Immunostaining for KLF4 protein (arrows) and myocardium (MF20) in E10.5 Nfatc1Cre;Krit1fl/fl and Krit1fl/fl littermate hearts. (G) Immunoblot analysis of KLF2 protein in whole E10.5 Nfatc1Cre;Krit1fl/fl and Nfatc1Cre;Krit1fl/+ and Krit1fl/fl littermate hearts. GAPDH is shown as a loading control. (H) Immunostaining using anti-DPEAAE antibody to detect ADAMTS-cleaved versican reveals increased levels in the E10.5 Nfatc1Cre;Krit1fl/fl heart. Boxed regions are shown at higher magnification on the right. (I) Immunoblot analysis of lysate derived from whole E10.5 hearts reveals increased levels of cleaved versican (DPEAAE) and the ADAMTS5 protease with endocardial loss of Krit1. GAPDH is shown as a loading control. Scale bars represent 100 μm. ∗p < 0.05; ∗∗p < 0.01; ∗∗∗p < 0.001. EXPRESSION / LABELING:
PHENOTYPE:
|
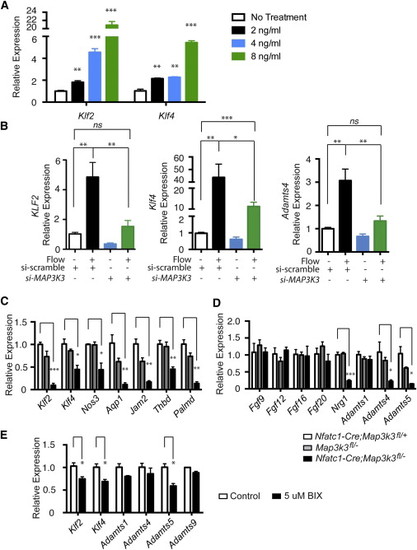
(A) Tetracycline-regulated expression of BirA-MEKK3 drives dose-dependent expression of KLF2 and KLF4 in HUVEC. (B) siRNA knockdown of MEKK3 in HUVEC blocks flow-induced expression of KLF2, KLF4 and ADAMTS4. HUVEC were exposed to 16 hr of laminar shear after exposure to siRNA directed against MEKK3 (MAP3K3) or control, scrambled siRNA. N = 5; p < 0.0001. (C) qPCR of E10.5 hearts reveals severely reduced levels of Klf2, Klf4 and known KLF2/4 target genes following endocardial Mekk3 (Map3k3) deletion. N = 3 for all groups. (D) qPCR of E10.5 hearts reveals reduced levels of Nrg1 and Adamts5 but normal levels of FGFs following endocardial Mekk3 (Map3k3) deletion. N = 3 for all groups. (E) qPCR of E9.5 wild-type mouse hearts following 24 hr incubation in medium containing the MEK5 inhibitor BIX02188 (“BIX”) or DMSO (“control”). N = 3 for all groups. Error bars represent SEM. ∗p < 0.05; ∗∗p < 0.01; ∗∗∗p < 0.001; ∗∗∗∗p < 0.0001. |
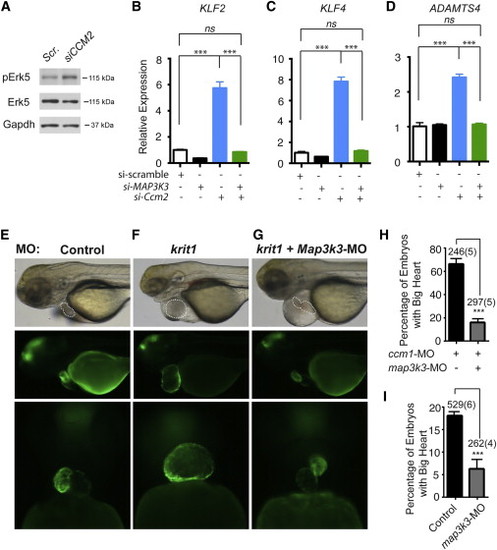
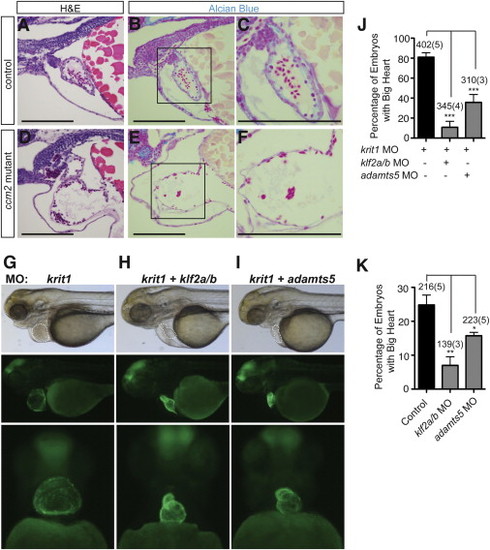
(A) siRNA knockdown of CCM2 increases the level of phospho-ERK5 in cultured HUVEC. (B–D) siRNA knockdown of CCM2 increases the expression of KLF2, KLF4, and ADAMTS4 in HUVEC, and these changes in gene expression are reversed by siRNA knockdown of MEKK3 (MAP3K3). Error bars represent SEM. (E and F) Injection of zebrafish embryos with krit1 morpholinos results in a big heart at 72 hpf in i-fabp:GFP transgenic embryos in which the heart is fluorescently labeled. (G) Injection of morpholinos targeting both krit1 and map3k3 rescues the big heart phenotype at 72 hpf. (H) Efficiency of rescue of the krit1 morphant heart phenotype with map3k3 morpholinos. ∗∗∗p < 0.001. (I) Knockdown of map3k3 rescues the cardiac phenotype in ccm2 mutant zebrafish embryos. The frequency of a big heart phenotype in the offspring of ccm2+/− intercrosses treated with control or map3k3 morpholinos is shown. ∗∗∗p < 0.001. The number of total embryos analyzed and number experimental repeats (in parentheses) are indicated above each bar in (H) and (I); Error bars represent SEM. Scale bars represent 100 μm. EXPRESSION / LABELING:
PHENOTYPE:
|
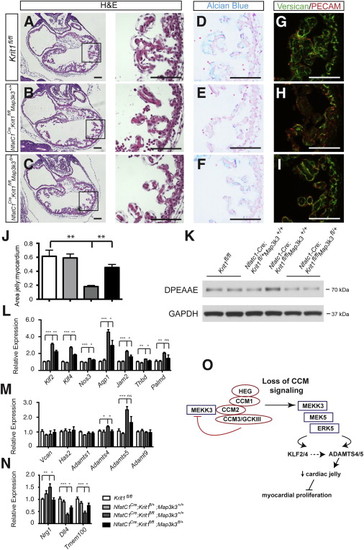
(A–C) The endocardial-myocardial space occupied by cardiac jelly is increased in Nfatc1Cre;Krit1fl/fl;Map3k3fl/+ hearts compared with Nfatc1Cre;Krit1fl/fl;Map3k3+/+ littermates at E10.5. Higher magnification images of the boxed regions are shown on the right. (D–F) Alcian blue staining for cardiac jelly is increased in Nfatc1Cre;Krit1fl/fl;Map3k3fl/+ hearts compared with Nfatc1Cre;Krit1fl/fl;Map3k3+/+ littermates at E10.5. (G–I) Versican in cardiac jelly is increased in Nfatc1Cre;Krit1fl/fl;Map3k3fl/+ hearts compared with Nfatc1Cre;Krit1fl/fl;Map3k3+/+ littermates at E10.5. (J) The ratio of the area occupied by cardiac jelly to that occupied by myocardium in the trabeculae is increased in E10.5 Nfatc1Cre;Krit1fl/fl;Map3k3fl/+ hearts compared with Nfatc1Cre;Krit1fl/fl;Map3k3+/+ littermates. N = 3 embryos; nine sections analyzed for each group. Error bars indicate SEM. (K) Immunoblot analysis of lysate derived from whole E10.5 hearts reveals higher levels of cleaved versican (DPEAAE) in Nfatc1Cre;Krit1fl/fl;Map3k3+/+ hearts compared with Nfatc1Cre;Krit1fl/fl;Map3k3fl/+ littermates. GAPDH is shown as a loading control. (L–N) qPCR of E10.5 hearts reveals normalized expression of Klf2, Klf4, KLF2/4 target genes, Nrg1, Dll4, Tmem100, Adamts4 and Adamts5 in Nfatc1Cre;Krit1fl/fl;Map3k3fl/+ hearts compared with Nfatc1Cre;Krit1fl/fl;Map3k3+/+ littermates at E10.5. ∗p < 0.05; ∗∗p < 0.01; ∗∗∗p < 0.001. Scale bars represent 100 μm. Error bars indicate SEM. (O) CCM regulation of MEKK3 activity and gene expression. The CCM complex binds MEKK3 through interaction with CCM2 and blocks MEKK3 signaling (left). Loss of the CCM complex increases MEKK3-ERK5 signaling and the expression of Klf2 and Adamts5, resulting in the breakdown of cardiac jelly and reduced myocardial proliferation (right). |
Reprinted from Developmental Cell, 32, Zhou, Z., Rawnsley, D.R., Goddard, L.M., Pan, W., Cao, X.J., Jakus, Z., Zheng, H., Yang, J., Arthur, J.S., Whitehead, K.J., Li, D., Zhou, B., Garcia, B.A., Zheng, X., Kahn, M.L., The cerebral cavernous malformation pathway controls cardiac development via regulation of endocardial MEKK3 signaling and KLF expression, 168-80, Copyright (2015) with permission from Elsevier. Full text @ Dev. Cell