
|
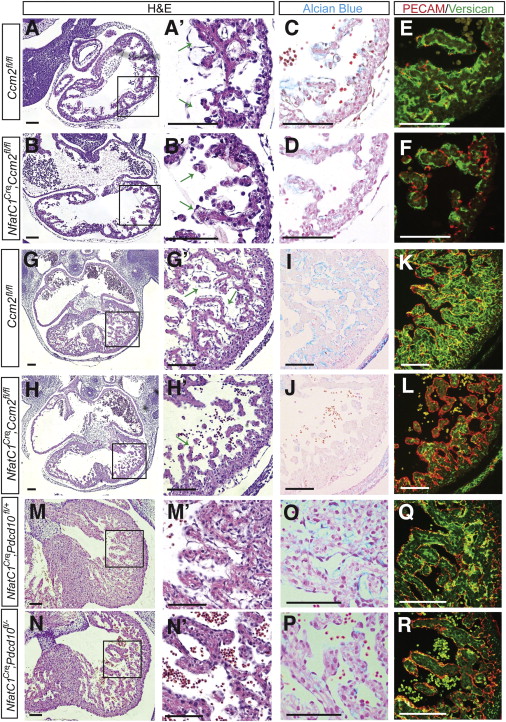
Fig. 2 (A and B) Thin myocardium and reduced endocardial-myocardial space in Nfatc1Cre;Ccm2fl/fl hearts at E10.5. (A′ and B′) Higher magnification images of the regions boxed in (A) and (B). (B) Error bars represent SEM. (C and D) Reduced Alcian blue staining in Nfatc1Cre;Ccm2fl/fl hearts at E10.5. Error bars represent SEM. (E and F) Reduced intact versican in in Nfatc1Cre;Ccm2fl/fl hearts at E10.5. (G and H) Thin myocardium and reduced endocardial-myocardial space in Nfatc1Cre;Ccm2fl/fl hearts at E12.5. (G′ and H′) Higher magnification images of the regions boxed in (G) and (H). (I and J) Reduced Alcian blue staining in Nfatc1Cre;Ccm2fl/fl hearts at E12.5. (J) Error bars represent SEM. (K and L) Reduced intact versican in in Nfatc1Cre;Ccm2fl/fl hearts at E12.5. (K) Error bars represent SEM. (M and N) Thin myocardium and reduced endocardial-myocardial space in Nfatc1Cre;Pdcd10fl/fl hearts at E12.5. (M′ and N′) Higher magnification images of the regions boxed in (M) and (N). (O and P) Reduced Alcian blue staining in Nfatc1Cre; Pdcd10fl/fl hearts at E12.5. (Q and R) Reduced intact versican in in Nfatc1Cre; Pdcd10fl/fl hearts at E12.5. Scale bars represent 100 μm.
Reprinted from Developmental Cell, 32, Zhou, Z., Rawnsley, D.R., Goddard, L.M., Pan, W., Cao, X.J., Jakus, Z., Zheng, H., Yang, J., Arthur, J.S., Whitehead, K.J., Li, D., Zhou, B., Garcia, B.A., Zheng, X., Kahn, M.L., The cerebral cavernous malformation pathway controls cardiac development via regulation of endocardial MEKK3 signaling and KLF expression, 168-80, Copyright (2015) with permission from Elsevier. Full text @ Dev. Cell