
- Title
-
The small molecule DIPQUO promotes osteogenic differentiation via inhibition of glycogen synthase kinase 3 β signaling
- Authors
- Cook, B., Walker, N., Zhang, Q., Chen, S., Evans, T.
- Source
- Full text @ J. Biol. Chem.

Kinase profiling identifies GSK3-β as a biochemical effector of DIPQUO-mediated inhibition. A, to identify putative biochemical effector candidates for DIPQUO, in vitro FRET-based kinase profiling assays were performed using 10 μM DIPQUO. Sixty different kinases were tested in duplicate using Z'-LYTE (black spheres), LanthaScreen (blue spheres), and Adapta (purple spheres) assays. Kinases were scored for inhibition (positive scores) or activation (negative scores); for clarity and brevity, only positive scores are shown, with an arbitrary threshold of 70% inhibition (red dotted line) chosen for follow-up validation assays, with kinases achieving this threshold denoted by red spheres on graph x-axis, and in red print on the sidebar. Only GSK3-β (black arrow) displayed 100% inhibition, in both duplicate tests. Values are reported as the means ± SD. B, cellular thermal shift assay (CETSA) analysis of GSK3-β protein stability after 1 h of 10 μM DIPQUO treatment in C2C12 cells, compared with treatment with the inactive structural analog BT344 (also 10 μM). CETSA was performed across a broad temperature range (37–67 °C, upper panel) and a narrow range (50–60 °C, lower panel). Relative protein levels were quantified at each temperature gradient point from 50 to 60 °C in a 10-min thermal challenge and plotted on the graph at right in a decay curve to obtain a Tm (50 percent relative expression) of 53.1 °C for BT344 and 54.9 °C for DIPQUO. Values are reported as the means ± SD; ∗p < 0.05 and ∗∗p < 0.01 in unpaired two-tailed Student's t test. Two-way ANOVA yielded F = 3.805 and p = 0.0096. Inhibition of GSK3-β using indicated doses of the commercially available inhibitors CHIR99021 (CHIR) or AZD2858 (AZD) stimulated (C) ALP expression and (D) ALP enzymatic activity. Expression was detected using alkaline naphthol and hematoxylin staining, and activity was quantified using colorimetric analysis of pNPP substrate digestion, after 3-day treatment of C2C12 cells with 10 μM DIPQUO. Activity was normalized to the total protein content for each sample. Values are reported as the means ± S.D.; ∗∗p < 0.01 and ∗∗∗p < 0.001 in unpaired two-tailed Student's t test. Ordinary one-way ANOVA yielded F = 42.95 and p = 0.0003. The scale bar in panel C represents 200 μm. In all panels, representative images are shown for experiments performed in three biological replicates. ALP, alkaline phosphatase; GSK3-β, glycogen synthase kinase 3-beta; pNPP, p-nitrophenylphosphate; Tm, melting temperature. |

Small-molecule inhibition of other putative kinase effectors fails to promote alkaline phosphatase expression. A, for all other kinases that displayed >70% inhibition by DIPQUO in the profiling assay, C2C12 cells were treated for 3 days with commercially available small-molecule inhibitors in the concentrations shown and stained for ALP expression. Inhibitors were as follows: dorsomorphin (DM), PV1019 (PV), Chk2inhII (Chki), RO3306 (RO), roscovitine (Rosco), CRT006 (CRT), XMU-MP-1 (XMU), Bosutinib (Bosu), LRRK2-IN-1 (LRRKi), and GSK2578215a (GSK257). The scale bar represents 200 μm. B, cells were similarly treated with dual combinations of the same kinase inhibitors (for each kinase, only one inhibitor was chosen based on availability) to assess whether simultaneous inhibition of different pathways would synergize to result in ALP expression. Treatments were performed at the same concentrations, with the exception of CHIR treatment, which was used at a concentration determined empirically to be subthreshold for ALP staining. For all panels, representative images are shown from experiments that were performed in at least three biological replicates. The scale bar represents 200 μm. ALP, alkaline phosphatase; CHIR, Wnt signaling activator CHIR99021. |
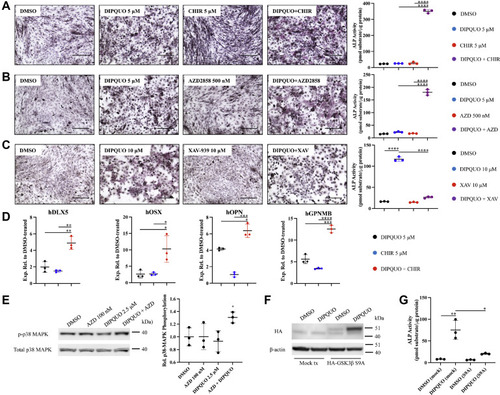
DIPQUO can synergize with other known GSK3-β inhibitors to promote osteogenic differentiation. C2C12 cells were treated for 3 days with (A) subthreshold (5 μM) DIPQUO, (5 μM) CHIR, or a combination thereof or (B) subthreshold DIPQUO, (500 nM) AZD, or a combination thereof and analyzed by staining for ALP expression and by colorimetric substrate assay for ALP activity. C, ALP expression and activation normally promoted by the full dose of DIPQUO was attenuated by cotreating C2C12 cells with 10 μM XAV-939. The scale bar in panels A–C represents 200 μm. Values in ALP activity graphs are reported as the means ± SD; ∗∗∗∗p < 0.0001 in unpaired two-tailed Student's t test. Ordinary one-way ANOVA yielded F = 1868 and p < 0.0001 in panel A, F = 579.6 and p < 0.0001 in panel B, and F = 858.3 and p < 0.0001 in panel C. D, differentiating human skeletal muscle satellite cells were cotreated for 3 days with low-dose DIPQUO and CHIR (5 μM each) and then analyzed by quantitative RT-PCR for expression of transcripts associated with osteoblast specification, compared with treatment alone. Relative expression levels compared with DMSO-treated samples and normalized to glyceraldehyde 3-phosphate dehydrogenase are reported as the means ± SD; ∗p < 0.05, ∗∗p < 0.01, ∗∗∗p < 0.001, and ∗∗∗∗p < 0.0001 in unpaired two-tailed Student's t test. Ordinary one-way ANOVA yielded F = 29.08 and p = 0.0008 for hDLX5 (DISTAL-LESS HOMEOBOX 5); F = 9.654 and p = 0.0133 for hOSX (OSTERIX); F = 81.15 and p < 0.0001 for hOPN (OSTEOPONTIN); and F = 110.1 and p < 0.0001 for hGPNMB (OSTEOACTIVIN). E, synergistic activation of p38 MAPK was analyzed by Western blotting after 2.5 h treatment with subthreshold concentrations of AZD (100 nM) and DIPQUO (2.5 μM), compared with cotreatment using the same concentrations. Relative phospho-p38 MAPK levels are reported as the means ± SD; ∗p < 0.05. Ordinary one-way ANOVA yielded F = 3.521 and p = 0.0686. F, C2C12 cells were either mock-transfected or transfected for 24 h with hemagglutinin-tagged GSK3-β containing a serine-to-alanine mutation (S9A), treated with DIPQUO or DMSO vehicle, and analyzed by Western blotting for construct expression. G, equivalent samples were analyzed for ALP activity using colorimetric assay for pNPP substrate after 3 days. Activity levels are normalized to the total protein and reported as the mean ± SD; ∗p < 0.05 and ∗∗p < 0.01 in unpaired two-tailed Student's t test. Ordinary one-way ANOVA yielded F = 25.60 and p = 0.0002. In all figure panels, representative images are shown from at least three biological replicates. ALP, alkaline phosphatase; AZD, AstraZeneca GSK3-β-specific inhibitor AZD2858; CHIR, Wnt signaling activator CHIR99021; GSK3-β, glycogen synthase kinase 3-beta; pNPP, p-nitrophenylphosphate. |

DIPQUO promotes β-catenin accumulation and activity. C2C12 cells were treated with DIPQUO for (A) time periods and (B) doses indicated in time-course and dose–response analyses to examine β-catenin expression levels by Western blotting in whole-cell extracts. Associated graphs below show expression levels compared with DMSO-treated controls. Relative β-catenin levels are reported as the means ± SD; ∗p < 0.05 and ∗∗p < 0.01 in unpaired two-tailed Student's t test. Ordinary one-way ANOVA yielded F = 3.237 and p = 0.0225 in panel A and F =3.170 and p = 0.0168 in panel B. C, luciferase activity assay using transient expression of GFP-T-cell factor/lymphoid enhancer-binding factor lentivirus (MOI = 20) in 293T cells, followed by treatment with DMSO, 10 μM CHIR or 10 μM DIPQUO. The scale bar represents 50 μm. Luciferase activity normalized to DMSO-treated samples is reported as the mean ± SD; ∗∗∗p < 0.001 in unpaired two-tailed Student's t test. Ordinary one-way ANOVA yielded F = 67.84 and p < 0.0001. Representative images from experiments using at least three biological replicates are shown for all figure panels. MOI, multiplicity of infection; CHIR, Wnt signaling activator CHIR99021. |
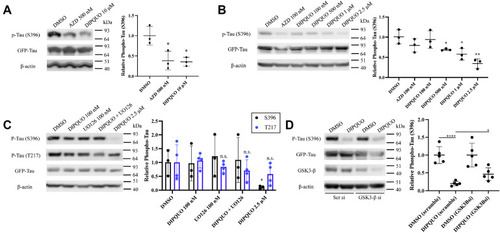
DIPQUO blocks phosphorylation of tau microtubule-associated protein. A, NIH/3T3 fibroblasts were transfected with GFP-tagged human four-repeat WT tau (4R0N) and treated with 500 nM AZD or 10 μM DIPQUO for 24 h and then analyzed by Western blotting for tau expression and activity via phosphorylation of S396. Phospho-S396-tau was quantified as a ratio to total tau in the graph at right. Values are reported as the means ± SD; ∗p < 0.05 in unpaired two-tailed Student's t test. Ordinary one-way ANOVA yielded F = 10.12 and p = 0.0119. B, further dose–response Western blotting analysis of tau S396 phosphorylation demonstrated a dose-dependent relationship for DIPQUO, with significant inhibition at the 500 nM dose. Values are reported as the means ± SD; ∗p < 0.05 and ∗∗p < 0.01 in unpaired two-tailed Student's t test. Ordinary one-way ANOVA yielded F = 7.549 and p = 0.0020. C, phosphorylation of tau S396 and T217 was analyzed after treatment with DIPQUO in the absence or presence of the ERK1/2 inhibitor UO126. Phospho-tau was quantified in the graph as a ratio to total tau, normalized to β-actin, with P-tau-S396 in black and P-tau-T217 in blue. Values are reported as the means ± SD; ∗p < 0.05 in unpaired two-tailed Student's t test. Two-way ANOVA yielded F = 1.235 and p = 0.3296. D, depletion of GSK3-β for 24 h with siRNA partially restored S396 phosphorylation of tau after an additional 24 h of 10 μM DIPQUO treatment. The graph at right shows ratio of phospho-S396-tau to total tau, normalized to β-actin protein loading control. Values are reported as the means ± SD; ∗p < 0.05 and ∗∗∗∗p < 0.0001 in unpaired two-tailed Student's t test. Ordinary one-way ANOVA yielded F = 15.61 and p < 0.0001. Representative images from experiments using at least three biological replicates are shown for all figure panels. AZD, AstraZeneca GSK3-β-specific inhibitor AZD2858; GSK3-β, glycogen synthase kinase 3-beta. |