
Fig. 5
- ID
- ZDB-FIG-220224-34
- Publication
- Cook et al., 2021 - The small molecule DIPQUO promotes osteogenic differentiation via inhibition of glycogen synthase kinase 3 β signaling
- Other Figures
- All Figure Page
- Back to All Figure Page
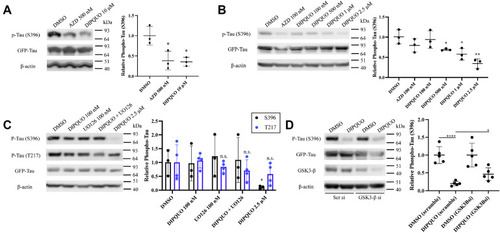
DIPQUO blocks phosphorylation of tau microtubule-associated protein. A, NIH/3T3 fibroblasts were transfected with GFP-tagged human four-repeat WT tau (4R0N) and treated with 500 nM AZD or 10 μM DIPQUO for 24 h and then analyzed by Western blotting for tau expression and activity via phosphorylation of S396. Phospho-S396-tau was quantified as a ratio to total tau in the graph at right. Values are reported as the means ± SD; ∗p < 0.05 in unpaired two-tailed Student's t test. Ordinary one-way ANOVA yielded F = 10.12 and p = 0.0119. B, further dose–response Western blotting analysis of tau S396 phosphorylation demonstrated a dose-dependent relationship for DIPQUO, with significant inhibition at the 500 nM dose. Values are reported as the means ± SD; ∗p < 0.05 and ∗∗p < 0.01 in unpaired two-tailed Student's t test. Ordinary one-way ANOVA yielded F = 7.549 and p = 0.0020. C, phosphorylation of tau S396 and T217 was analyzed after treatment with DIPQUO in the absence or presence of the ERK1/2 inhibitor UO126. Phospho-tau was quantified in the graph as a ratio to total tau, normalized to β-actin, with P-tau-S396 in black and P-tau-T217 in blue. Values are reported as the means ± SD; ∗p < 0.05 in unpaired two-tailed Student's t test. Two-way ANOVA yielded F = 1.235 and p = 0.3296. D, depletion of GSK3-β for 24 h with siRNA partially restored S396 phosphorylation of tau after an additional 24 h of 10 μM DIPQUO treatment. The graph at right shows ratio of phospho-S396-tau to total tau, normalized to β-actin protein loading control. Values are reported as the means ± SD; ∗p < 0.05 and ∗∗∗∗p < 0.0001 in unpaired two-tailed Student's t test. Ordinary one-way ANOVA yielded F = 15.61 and p < 0.0001. Representative images from experiments using at least three biological replicates are shown for all figure panels. AZD, AstraZeneca GSK3-β-specific inhibitor AZD2858; GSK3-β, glycogen synthase kinase 3-beta. |