
- Title
-
Cardiomyocyte heterogeneity during zebrafish development and regeneration
- Authors
- Tsedeke, A.T., Allanki, S., Gentile, A., Jimenez-Amilburu, V., Rasouli, S.J., Guenther, S., Lai, S.L., Stainier, D.Y.R., Marín-Juez, R.
- Source
- Full text @ Dev. Biol.

Transcriptional analysis of developmentally regulated genes in zebrafish hearts. (A) Heatmap of the Row Z-score calculated from average probe intensity from microarray profiling for isl1, myl10, nkx2.7, tnnc2, tpm4b, ckmt2a, ckmt2b, tnni4b.3, and myl7 in embryonic (52 hpf) and larval (7dpf) hearts. (B) Heatmap of the Row Z-score calculated from the normalized reads (RPKM) from RNA-seq for isl1, myl10, nkx2.7, tnnc2, tpm4b, ckmt2a, ckmt2b, tnni4b.3, and myl7 in larval (96 hpf) and adult hearts. (C, D) RT-qPCR analysis of isl1, myl10, nkx2.7, tnnc2, and tpm4b (C) and ckmt2a, ckmt2b, tnni4b.3, and myl7 (D) mRNA levels in extracted hearts from 72 hpf, 96 hpf, 7 dpf, and adult zebrafish (n = 4 per stage). The Ct values can be found in Table S2. P values determined by Kruskal-Wallis test with Dunn’s multiple comparisons test. |
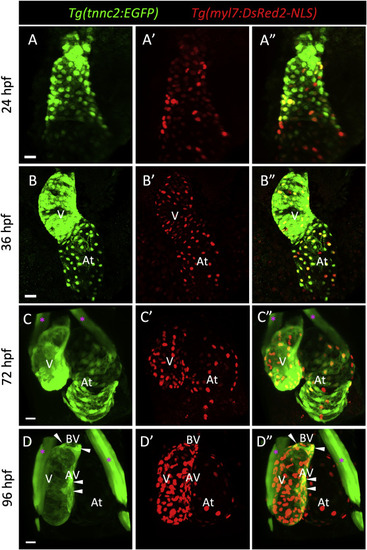
The tnnc2 reporter is expressed by embryonic cardiomyocytes in zebrafish. (A–D) Confocal images (maximum intensity projections) of wholemount Tg(tnnc2:EGFP); Tg(myl7:DsRed2-NLS) hearts at 24 (A-A″), 36 (B–B″), 72 (C–C″) and 96 (D-D″) hpf. White arrowheads point to EGFP+ CMs around the atrioventricular (AV) and bulboventricular (BV) areas at 96 hpf (D–D″). Magenta asterisks mark craniofacial muscles. V: ventricle; At: atrium. Scale bars: 20 μm. |
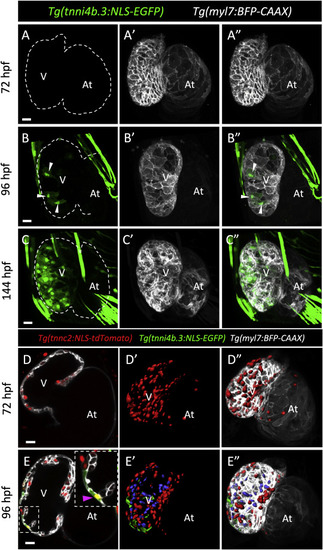
The tnni4b.3 reporter is expressed by cardiomyocytes starting at early larval stages in zebrafish. (A-C″) Confocal images (maximum intensity projections) of wholemount Tg(tnni4b.3:NLS-EGFP); Tg(myl7:BFP-CAAX) hearts at 72 (A-A″), 96 (B–B″) and 144 (C–C″) hpf. White arrowheads point to EGFP+ CMs at 96 hpf (B–B″). White dashed lines outline the hearts. (D-E″) Mid-sagittal (D, E) and wholemount 3D rendered (D′, D″, E′, E″) confocal images of Tg(tnnc2:NLS-tdTomato); Tg(tnni4b.3:NLS-EGFP); Tg(myl7:BFP-CAAX) hearts at 72 (D-D″) and 96 (E-E″) hpf. tnnc2:NLS-tdTomato+ CMs located in the trabecular layer are highlighted in blue. Magenta arrowhead points to an NLS-tdTomato+/NLS-EGFP+ outer curvature CM. V: ventricle; At: atrium. Scale bars: 20 μm. |
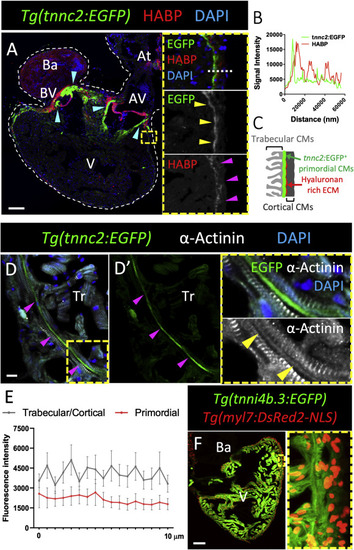
tnnc2 and tnni4b.3 reporter expression in the adult zebrafish heart. (A) Sagittal section of a Tg(tnnc2:EGFP) adult heart stained for EGFP expression (green), HABP (red) and DNA (blue). Cyan arrowheads point to tnnc2:EGFP+ CMs in the atrioventricular (AV) and bulboventricular (BV) boundaries. Insets show high magnification images of the ventricular wall. Yellow arrowheads point to tnnc2:EGFP+ primordial CMs. Magenta arrowheads point to HABP staining. White dashed line outlines the heart. (B) tnnc2:EGFP (green line) and HABP (red line) fluorescence intensity measured along the white dotted line in (A). (C) Schematic representation of tnnc2:EGFP+ CMs and Hyaluronan rich connective tissue in the adult zebrafish heart. (D) Sagittal section of a Tg(tnnc2:EGFP) adult ventricular wall stained for EGFP expression (green), α-Actinin (white), and DNA (blue). Magenta arrowheads point to tnnc2:EGFP+ primordial layer CMs. Yellow arrowheads point to tnnc2:EGFP+ CMs lacking α-Actinin striations. (E) Quantification of α-Actinin fluorescence intensity on a 10 μm line drawn along cortical/primordial/trabecular CMs perpendicular to the striations. (F) Unstained sagittal section of a Tg(tnni4b.3:EGFP); Tg(myl7:DsRed2-NLS) adult zebrafish heart. Tr: trabecular myocardium; At: atrium; Ba: bulbus arteriosus. Scale bars: 100 μm (A, F) and 10 μm (D). |

Primordial layer cardiomyocytes display higher Notch signaling and express embryonic cardiomyocyte genes. (A) Sagittal section of a Tg(tp1:EGFP) adult ventricular wall stained for EGFP expression (green) and HABP (red). (B) tp1:EGFP (green line) and HABP (red line) fluorescence intensity measured along the white dotted line in (A). (C) Sagittal section of a Tg(tp1:NLS-mCherry); Tg(tnnc2:EGFP) adult ventricle stained for EGFP expression (green), mCherry expression (red) and DNA (blue). Yellow arrowheads point to tnnc2:EGFP+/tp1:NLS-mCherry+ cells. (D and E) Gene ontology plots (D) from Gene Set Enrichment Analysis (GSEA) and volcano plot (E) comparing tp1:EGFP+/myl7:DsRed2-NLS+ vs myl7:EGFP+ RNA-seq. Scale bars: 10 μm. |

Cortically located border zone cardiomyocytes upregulate the Tg(tnnc2:EGFP) reporter during adult zebrafish heart regeneration. (A) 7 dps and (D) 7 dpci Tg(tnnc2:EGFP); Tg(myl7:DsRed-NLS) ventricular sections stained for EGFP (green), CM nuclei (red), embCMHC (white) and DNA (blue). (B–C″) Insets show high-magnification images of 7 dps tnnc2:EGFP+/embCMHC+ CMs surrounding the AV valve (B–B″) and tnnc2:EGFP+ primordial layer CMs. (E-F″) Insets show high-magnification images of 7 dpci tnnc2:EGFP+/embCMHC+ CMs surrounding the AV valve (E-E″) and cortically located tnnc2:EGFP+/embCMHC+ CMs protruding into the injured area (F–F″). Cyan dashed box shows a high magnification image of tnnc2:EGFP+/embCMHC+ CMs displaying sarcomeric structures. (G) 14 dpci Tg(tnnc2:EGFP); Tg(myl7:DsRed-NLS) ventricular sections stained for EGFP (green), CM nuclei (red), and DNA (blue). (H–H″) Insets show high-magnification images of 14 dpci cortically located tnnc2:EGFP+/embCMHC+ CMs protruding into the injured area. White arrowheads point to tnnc2:EGFP+ CMs in the AV canal. Cyan arrowheads point to tnnc2:EGFP+ CMs in the primordial layer. Yellow arrowheads point to regenerating tnnc2:EGFP+ CMs in the injured area. V: ventricle; Ba: bulbus arteriosus; AV: atrioventricular canal. Scale bars: 100 μm (A, D, G), 50 μm (B–B″, E-E″), and 20 μm (C–C″, F–F″, H–H″). |

Tg(tnni4b.3:EGFP) expression is downregulated in border zone cardiomyocytes during adult zebrafish heart regeneration. (A, B and C) Sagittal sections from 7 dpci (A), 14 dpci (B) and uninjured (C) Tg(tnni4b.3:EGFP) hearts showing endogenous EGFP expression fluorescence intensity (rainbow gradient), MHC (magenta), and DNA (white). Yellow dotted lines demarcate the injured area. (A′-A‴, B′-B‴) Insets of (A) and (B), respecitvely, showing high-magnification images of MHC+/tnni4b.3:EGFP+ border zone CMs. Yellow dotted lines demarcate the injured area. (C′-C‴) Insets of (C) showing high-magnification images of MHC+/tnni4b.3:EGFP+ AV boundary CMs. Yellow arrowheads point to AV boundary CMs with lower tnni4b.3:EGFP expression. Scale bars: 200 μm (A, B), 100 μm (C). |
Reprinted from Developmental Biology, 476, Tsedeke, A.T., Allanki, S., Gentile, A., Jimenez-Amilburu, V., Rasouli, S.J., Guenther, S., Lai, S.L., Stainier, D.Y.R., Marín-Juez, R., Cardiomyocyte heterogeneity during zebrafish development and regeneration, 259-271, Copyright (2021) with permission from Elsevier. Full text @ Dev. Biol.