FIGURE SUMMARY
Title

Subcellular Dissection of a Simple Neural Circuit: Functional Domains of the Mauthner-Cell During Habituation

Authors
Bátora, D., Zsigmond, Á., Lőrincz, I.Z., Szegvári, G., Varga, M., Málnási-Csizmadia, A.
Source
Full text @ Front. Neural Circuits

Characteristics of the M-cell mediated escape response, and its habituation. (A) Schematic representation of the startle circuit located in the hindbrain. The M-cell, a command neuron responsible for eliciting a startle response receive two excitatory inputs: VIII nerve inputs at the distal lateral dendrite (LD), and inputs from spiral fiber neurons (SFN) at the axon initial segment (AIS) via a feedforward excitatory circuit. Additionally, the M-cell is innervated by a glycinergic feedforward inhibitory circuit converging on the soma of the M-cell. (B) Representative image of an M-cell mediated escape response. Fish were placed in individual wells on a 6 × 6 custom plate with a speaker underneath delivering acoustic-vibrational stimuli. A high-speed camera set up above the plate was used to record the behavior. (C) Histogram showing the latency of observed escape responses. M-cell mediated escapes, often referred to as short-latency C-bends (SLC) are elicited approximately 2–12 ms after stimulus onset. Longer latency escape responses are mediated by neural circuits other than the M-cell. With our stimulus-delivery approach, the most frequently observed escapes happened 4–8 ms after the stimulus, consistent with the time window the M-cell operates in. Longer latency escapes were rarely observed. Latencies were manually calculated. Two-hundred and forty-three responses of 81 fish were measured. Inset: Fish treated with either 50 μM l-701 or vehicle show no significant difference in their distribution of response latency values ( n = 95, 100 responses from 19, 20 fish, p = 0.09, Kolmogorov–Smirnov Test). (D) Repetitive acoustic-vibrational stimulation using the 6 × 6 plate causes a progressive decline in escape responses. This decline is dependent on the frequency of the stimulation, with higher frequencies causing more rapid habituation. Ninety-min incubation in 50 μM l-701 greatly disrupts the habituation of the escape response (vehicle: n = 70, 80, and 70 for 0.2 Hz, 1 Hz, and 2 Hz, respectively; l-701: n = 70, 70 and 70 for 0.2 Hz, 1 Hz and 2 Hz, respectively). (E) Plotting the probability of an escape response at each time point during the stimulation based on averages from all fish, exponential fit used.

In vivo detection of glutamate-release on the M-cell by iGluSnFR. (A) Representative image of a transgenic Tg(hspgGFF62A:Gal4; 10xUAS:iGluSnFR) fish (6 dpf) in the M-cell region (dorsal view, anterior on top). As previously described, the M-cell receives two major glutamatergic inputs: direct connections from the VIII. nerve ends on the lateral dendrite (left gray box) while inputs coming from a feedforward excitatory network form the axon cap surrounding the AIS of the M-cell (right gray box). (B,C) Examples of a 1-min line-scans detecting spontaneous glutamate-release and revealing differences between the LD and the AIS using two-photon imaging. Spontaneous release was completely absent from the LD but was present in an infrequent and unordered fashion at the AIS, with an average of 2–4 releases/minute. (D) Administration of l-701 significantly increased the frequency of spontaneous glutamate-release at the AIS (each dot represents an average of three measurements, n = 12 fish, p = 0.02, paired sample t-test). (E,E’) The kinetic characteristics of the fluorescent signal after acoustic stimulation indicating glutamate release at the LD in the vehicle (n = 5 fish; five repetitions per fish) and 1–701 treated larvae (n = 6 fish; five repetitions per fish). (F,F’) The kinetic characteristics of the fluorescent signal after acoustic stimulation indicating glutamate release at the AIS in the vehicle (n = 5 fish; five repetitions per fish) and 1–701 treated larvae (n = 7 fish; five repetitions per fish). (G) Kinetic response curves were normalized and compared based on the time constant, which revealed no significant difference between the two regions of interest. Treatment with l-701 did not cause alterations in response dynamics either (five traces per fish, n = 5, 6, 5, 7, respectively, p = 0.77, one-way ANOVA). *p < 0.05; ns, not significant.

Differential properties of the LD and the AIS during setting the startle threshold. (A) Schematic representation of the setup used to monitor M-cell activity during escape response. (B) Probability of eliciting a startle response in the presence or absence of l-701 as a function of acoustic volume (dB) recorded simultaneously to glutamate-imaging. 50 μM l-701 significantly elevated the probability of startle responses at volumes larger than 83.8 dB (n = p < 0.001, two-sample t-test). No significant difference was observed at 81.8 dB. (C) Glutamate-release at the LD in the presence or absence of l-701 as a function of acoustic volume (dB). We used five different volumes, ranging from 81.8 dB to 91.7 dB, selected in such a way that three of these were well below the threshold level for eliciting an escape response, one near and one above it. Each fish received a series of five acoustic stimuli at each intensity. Fluorescent peak values for each stimulus from the corresponding volumes were averaged and normalized to the fluorescent peak value at the volume above the threshold level (91.7dB). Normalized fluorescent peak values remained unaltered at the LD to pharmacological manipulation (n = 10, 11 for the vehicle, treated respectively). (D) Glutamate-release at the AIS in the presence o absence of l-701 as a function of acoustic volume (dB). Normalized fluorescent peak values significantly increased at the AIS to pharmacological manipulation at volumes larger than 83.8 dB (n = 10, 11 for the vehicle, treated respectively, p < 0.01, two-sample t-test). No significant difference was observed at 81.8 dB. **p < 0.01, ***p < 0.001, ns, not significant.

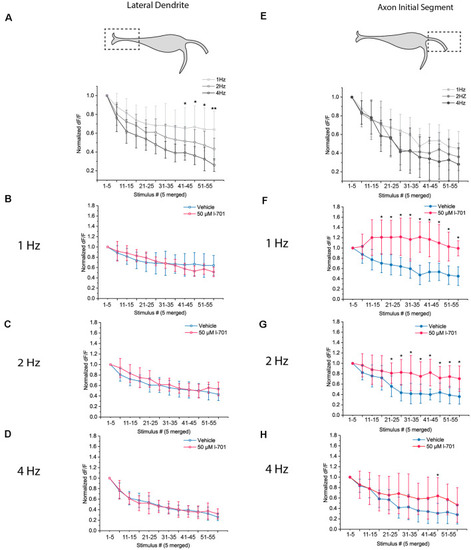
Dynamics of glutamate release in response to repetitive acoustic stimulation exhibit distinct properties at the LD and the AIS. Dynamics of presynaptic glutamate-release in response to repetitive acoustic stimulation at the regions of interest. The fish received 60 acoustic stimuli (91.7 dB) at frequencies ranging from 1 Hz to 4 Hz. Fluorescence values were recorded from both regions, peak fluorescence values of every five consecutive glutamate spike events were averaged and normalized to the mean of peak fluorescence values of the first five stimuli. Increasing the frequency of stimulation revealed different underlying mechanisms of depression in the two regions. (A) At the LD, depletion of presynaptic glutamate significantly increased with frequency LD [p values for the last four data points (stimulus 40–60) p = 0.03, 0.02, 0.04 and 0.002 respectively; n = 9, 8 and 6 for 1 Hz, 2 Hz, and 4 Hz, respectively]. (B–D) Bath application of 50 μM l-701 did not significantly alter the synaptic depression of glutamatergic endings at the LD at neither of the frequencies used for stimulation (two-sample t-test). (E) At the AIS, the initial rate of depression at 1 Hz could only be slightly altered with higher-frequency stimulation resulting in less significantly different data points than at the LD [p values for the last four data points (stimulus 40–60) p = 0.1, 0.06, 0.4 and 0.2, respectively; n = 11, 11 and 10 for 1 Hz, 2 Hz, and 4 Hz, respectively]. (F–H) Bath application of 50 μM l-701 significantly decreased the synaptic depression of glutamatergic nerve endings at the AIS. The perturbation was most prominent at 1 Hz (p < 0.05, two-sample t-test). The effects of 2 Hz stimulation were still significantly different from the control values (p < 0.05, two-sample t-test), whereas no significant difference was observed when comparing the values at 4 Hz stimulation (two-sample t-test). *p < 0.05, **p < 0.01.

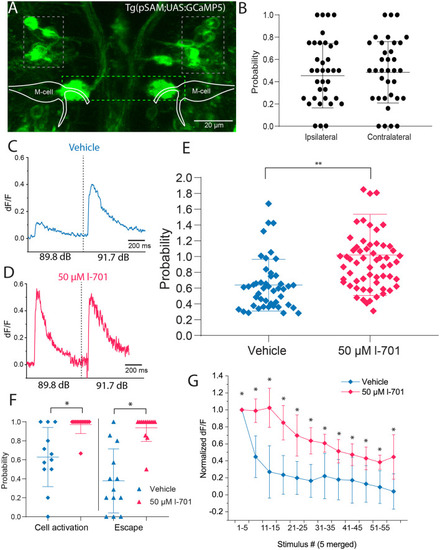
Spiral fiber neuron activity is modulated by NMDA receptor blockade in setting the startle threshold and habituation. (A) Representative image of the transgenic line pSAM. Grey boxes indicate the two clusters of SFNs. The green box shows the axon cap, a bundle of spiral fiber neuron axons surrounding the M-cell axon initial segment. (B) SFN activity does not significantly influence short-latency escape directionality after non-directional acoustic stimulation using our speaker system (n = 6 fish; five responses per fish). (C) Representative fluorescent trace indicating that delivering an acoustic stimulus below the startle threshold at 89.8 dB results in approximately 60% of the fluorescence level measured above the threshold at 91.7 dB. (D) Representative fluorescent trace indicating that administration of 50 μM l-701 increases fluorescence values at 89.8 dB to values measured at 91.7 dB. (E) Significant increase in fluorescence peak values in response to treatment with 50 μM l-701. Peak fluorescence values at 89.8 dB were normalized to values after stimulation at 91.7 dB (n = 8, 13 for vehicle, treated respectively, p = 0.0029, two-sample t-test). Lines represent the mean ± SD. (F) The probability of SFN activation at 89.8 dB in both vehicles and treated animals. The threshold for cell activation was defined as the mean value of baseline fluorescence of the cell +2 times the standard deviation of the baseline. At 89.8 dB control conditions, SFNs are active only 60% of the time. Treatment with l-701 results in an increase in probability of cell activation at 89.8 dB (n = 13 for vehicle and treated, respectively; p < 0.05, one-way ANOVA). (G) The activity of SFNs to repetitive acoustic stimulation at 1 Hz. Fluorescence peak values from every five stimuli were averaged and normalized to the mean value coming from the first five stimuli. Treatment with 50 μM l-701 significantly decreased the depression of cell activity (n = 6 and 8 for vehicle and treated, respectively; p < 0.05, two-sample t-test). *p < 0.05, **p < 0.01.

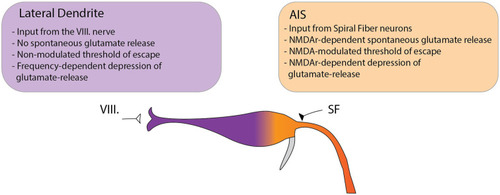
Model depicting the differential functions of glutamatergic Mauthner-cell inputs in setting the startle threshold and habituation. The M-cell receives two major glutamatergic inputs: the VIII nerve ending at the distal LD and input from SFNs ending at the proximal AIS. We observed several key differences between the two sites suggesting distinct roles in modulating the startle behavior. At the LD no spontaneous subthreshold glutamate release was observed. In setting the threshold to the startle reflex in response to acoustic stimulation, the release at the LD could not be modulated by NMDA receptor antagonism. Furthermore, the rate of depression of glutamate release to repeated stimulation was strongly dependent on the frequency of the stimuli but was not altered by NMDA receptor antagonism. In contrast, at the AIS spontaneous release events were frequently observed and could be increased by NMDA receptor blockade. In setting the startle threshold, glutamate release at the AIS strongly correlated with the probability of escape and was dependent on NMDA receptor activity. Additionally, NMDA receptor blockade strongly modulated the depression of glutamate release in response to repetitive acoustic stimulation.

Acknowledgments
This image is the copyrighted work of the attributed author or publisher, and ZFIN has permission only to display this image to its users. Additional permissions should be obtained from the applicable author or publisher of the image. Full text @ Front. Neural Circuits