FIGURE

Figure 4

ID
ZDB-FIG-210411-9
Publication
Bátora et al., 2021 - Subcellular Dissection of a Simple Neural Circuit: Functional Domains of the Mauthner-Cell During Habituation
Other Figures
All Figure Page
Back to All Figure Page
Figure 4

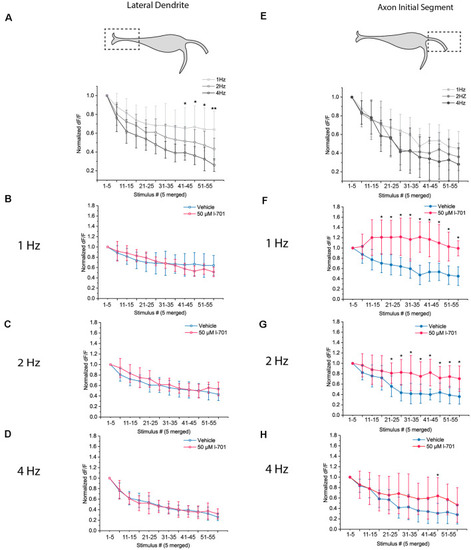
Dynamics of glutamate release in response to repetitive acoustic stimulation exhibit distinct properties at the LD and the AIS. Dynamics of presynaptic glutamate-release in response to repetitive acoustic stimulation at the regions of interest. The fish received 60 acoustic stimuli (91.7 dB) at frequencies ranging from 1 Hz to 4 Hz. Fluorescence values were recorded from both regions, peak fluorescence values of every five consecutive glutamate spike events were averaged and normalized to the mean of peak fluorescence values of the first five stimuli. Increasing the frequency of stimulation revealed different underlying mechanisms of depression in the two regions. (A) At the LD, depletion of presynaptic glutamate significantly increased with frequency LD [p values for the last four data points (stimulus 40–60) p = 0.03, 0.02, 0.04 and 0.002 respectively; n = 9, 8 and 6 for 1 Hz, 2 Hz, and 4 Hz, respectively]. (B–D) Bath application of 50 μM l-701 did not significantly alter the synaptic depression of glutamatergic endings at the LD at neither of the frequencies used for stimulation (two-sample t-test). (E) At the AIS, the initial rate of depression at 1 Hz could only be slightly altered with higher-frequency stimulation resulting in less significantly different data points than at the LD [p values for the last four data points (stimulus 40–60) p = 0.1, 0.06, 0.4 and 0.2, respectively; n = 11, 11 and 10 for 1 Hz, 2 Hz, and 4 Hz, respectively]. (F–H) Bath application of 50 μM l-701 significantly decreased the synaptic depression of glutamatergic nerve endings at the AIS. The perturbation was most prominent at 1 Hz (p < 0.05, two-sample t-test). The effects of 2 Hz stimulation were still significantly different from the control values (p < 0.05, two-sample t-test), whereas no significant difference was observed when comparing the values at 4 Hz stimulation (two-sample t-test). *p < 0.05, **p < 0.01.

Expression Data

Expression Detail
Antibody Labeling
Phenotype Data

Phenotype Detail
Acknowledgments
This image is the copyrighted work of the attributed author or publisher, and ZFIN has permission only to display this image to its users. Additional permissions should be obtained from the applicable author or publisher of the image. Full text @ Front. Neural Circuits