IMAGE

Figure 1

ID
ZDB-IMAGE-210411-7
Source
Figures for Bátora et al., 2021
Image
Figure Caption

Figure 1

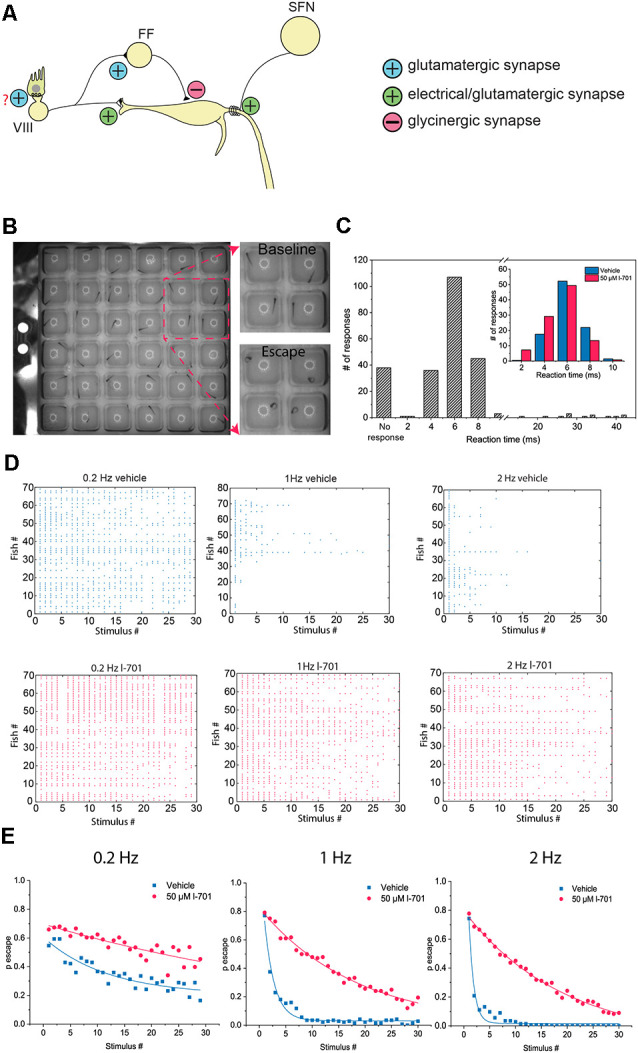
Characteristics of the M-cell mediated escape response, and its habituation. (A) Schematic representation of the startle circuit located in the hindbrain. The M-cell, a command neuron responsible for eliciting a startle response receive two excitatory inputs: VIII nerve inputs at the distal lateral dendrite (LD), and inputs from spiral fiber neurons (SFN) at the axon initial segment (AIS) via a feedforward excitatory circuit. Additionally, the M-cell is innervated by a glycinergic feedforward inhibitory circuit converging on the soma of the M-cell. (B) Representative image of an M-cell mediated escape response. Fish were placed in individual wells on a 6 × 6 custom plate with a speaker underneath delivering acoustic-vibrational stimuli. A high-speed camera set up above the plate was used to record the behavior. (C) Histogram showing the latency of observed escape responses. M-cell mediated escapes, often referred to as short-latency C-bends (SLC) are elicited approximately 2–12 ms after stimulus onset. Longer latency escape responses are mediated by neural circuits other than the M-cell. With our stimulus-delivery approach, the most frequently observed escapes happened 4–8 ms after the stimulus, consistent with the time window the M-cell operates in. Longer latency escapes were rarely observed. Latencies were manually calculated. Two-hundred and forty-three responses of 81 fish were measured. Inset: Fish treated with either 50 μM l-701 or vehicle show no significant difference in their distribution of response latency values ( n = 95, 100 responses from 19, 20 fish, p = 0.09, Kolmogorov–Smirnov Test). (D) Repetitive acoustic-vibrational stimulation using the 6 × 6 plate causes a progressive decline in escape responses. This decline is dependent on the frequency of the stimulation, with higher frequencies causing more rapid habituation. Ninety-min incubation in 50 μM l-701 greatly disrupts the habituation of the escape response (vehicle: n = 70, 80, and 70 for 0.2 Hz, 1 Hz, and 2 Hz, respectively; l-701: n = 70, 70 and 70 for 0.2 Hz, 1 Hz and 2 Hz, respectively). (E) Plotting the probability of an escape response at each time point during the stimulation based on averages from all fish, exponential fit used.

Acknowledgments
This image is the copyrighted work of the attributed author or publisher, and ZFIN has permission only to display this image to its users. Additional permissions should be obtained from the applicable author or publisher of the image. Full text @ Front. Neural Circuits