
- Title
-
Transcriptome analyses of 7-day-old zebrafish larvae possessing a familial Alzheimer's disease-like mutation in psen1 indicate effects on oxidative phosphorylation, ECM and MCM functions, and iron homeostasis
- Authors
- Dong, Y., Newman, M., Pederson, S.M., Barthelson, K., Hin, N., Lardelli, M.
- Source
- Full text @ BMC Genomics
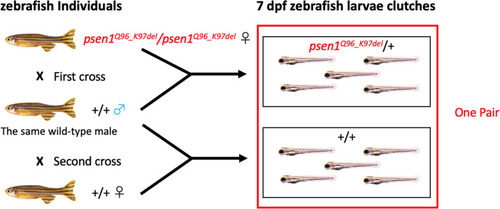
Mating scheme to generate pairs of 7 dpf zebrafish larval clutches |
|
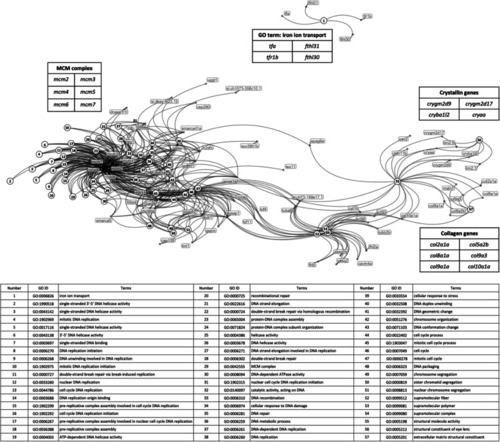
Network of relationships between DE genes and significantly-changed GO terms in the Goseq analysis. Dots represent DE genes and are labelled with gene names. Numbered circles represent those GO terms showing significant enrichment for the DE genes. The table below the network indicates the GO represented by each number |
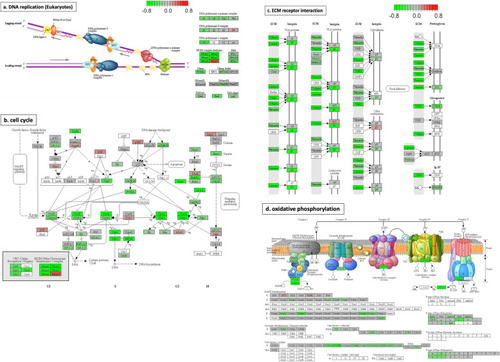
Diagrams for four significantly-changed KEGG pathways plotted using pathview [ |