
IMAGE
Fig. 4
- ID
- ZDB-IMAGE-210328-5
- Publication
- Dong et al., 2021 - Transcriptome analyses of 7-day-old zebrafish larvae possessing a familial Alzheimer's disease-like mutation in psen1 indicate effects on oxidative phosphorylation, ECM and MCM functions, and iron homeostasis
- All Figures
- Figures for Dong et al., 2021
Image
|
Figure Caption
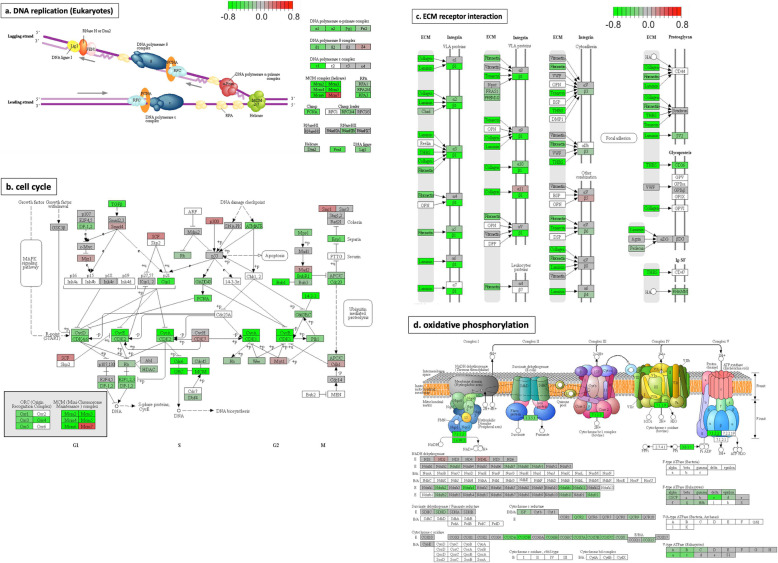
Fig. 4
Diagrams for four significantly-changed KEGG pathways plotted using pathview [
Acknowledgments
This image is the copyrighted work of the attributed author or publisher, and
ZFIN has permission only to display this image to its users.
Additional permissions should be obtained from the applicable author or publisher of the image.
Full text @ BMC Genomics