
- Title
-
Calycosin attenuates doxorubicin-induced cardiotoxicity via autophagy regulation in zebrafish models
- Authors
- Lu, X., Lu, L., Gao, L., Wang, Y., Wang, W.
- Source
- Full text @ Biomed. Pharmacother.
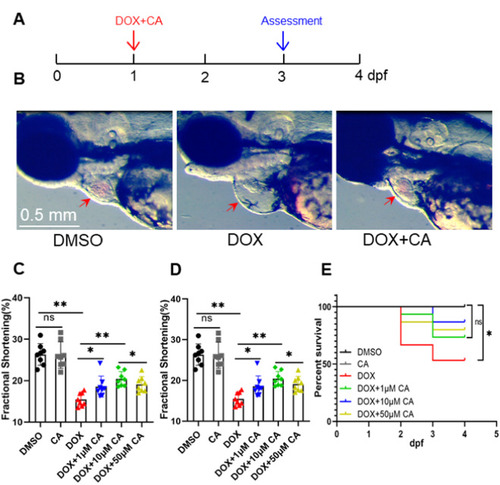
Calycosin improved the survival rate and reduced DIC in zebrafish embryos. (A) Experimental scheme for inducing cardiomyopathy in embryonic zebrafish. (DOX, 100 μM doxorubicin; CA, Calycosin; dpf, days post fertilization); (B) Representative images of no treatment, DOX-treated and DOX and 10 μM CA treated heart (DMSO control), arrows indicate location of the ventricle; (C, D) Quantification of fractional shortening and heart rate. n = 8 per group, one-way ANOVA followed by post hoc Tukey’s test was used. (E) CA treatment exerts salutary effects on embryonic DIC. n = 15. *P < 0.05, **P < 0.01. |
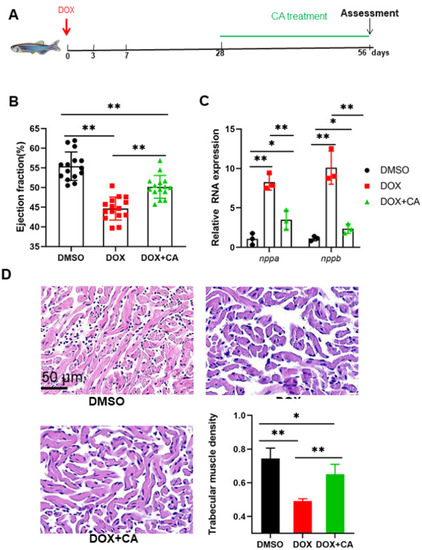
Cardioprotective effects of CA against Dox-induced cardiotoxicity in adult zebrafish. (A) Schematic of the schedule for CA administration and DOX injection. (B) High frequency echocardiography was performed at 56 days post injection to quantify cardiac functions. 0.01% DMSO was used as a control. (n = 15 per group) (C) CA treated fish showed less pathological cardiac remodeling after long-term doxorubicin treatment, examined by relative mRNA levels of nppa and nppb gene. n = 3 per group. One-way ANOVA followed by the Tukey post hoc test was used to compare multiple groups for each gene. (D) HE staining showed that CA preserved cardiomyocyte architecture. *P < 0.05, **P < 0.01. |
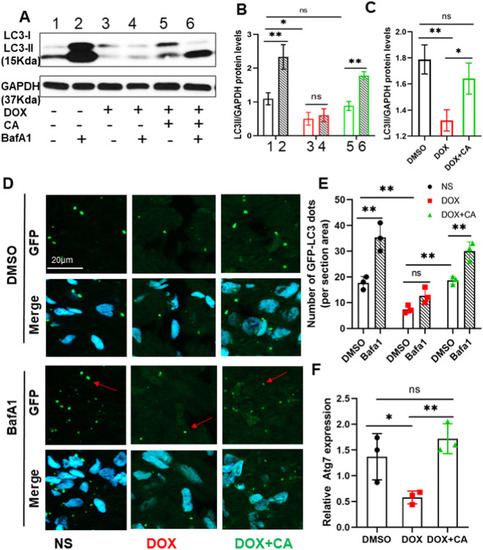
Effect of CA on autophagy in adult zebrafish DIC model. (A) Representative western blot showing changes in LC3II protein levels in the heart after DOX and CA treatment. Baflomycin A1 (30 nM) was administered 4 h before sacrifice the fish to assess autophagic flux changes. (B, C) Quantification of relative amounts of LC3II. n = 3 hearts per group on each time point. Bars represent mean ± SD. (D, E) Representative images and quantification of sectioned ventricles of Tg(GFP-Lc3) fish at 56 dpi with or without BafA1 treatment. Arrows: Lc3 aggregating dots formed during autophagy. (F) Relative RNA expression degree of atg7 in indicated group. *P < 0.05, **P < 0.01. EXPRESSION / LABELING:
PHENOTYPE:
|
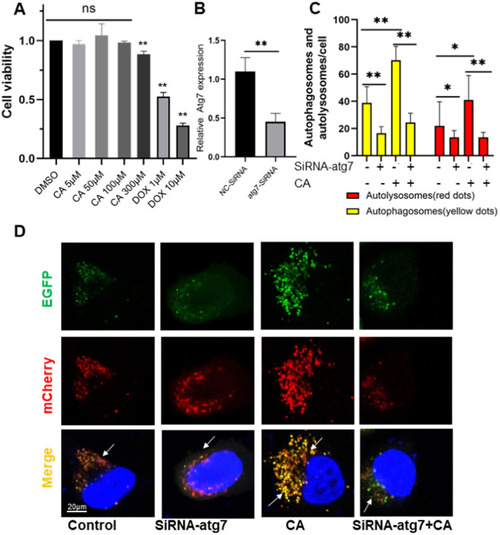
Effect of CA on cell autophagy. (A) Effects of DOX (1 and 10 μM) and CA (5, 50, 100, and 300 μM) alone on viability of H9C2 cells at 24 h by MTT assay (n = 3). (B) Atg7 was confirmed knockdown via RT-PCR in HeLa cells. (C) Quantitative analysis of yellow puncta (autophagosomes) and red puncta (autolysosomes). Data are expressed as mean ± SD. *P < 0.05 (D) Wild-type (Control) and atg7-knockout (SiRNA-atg7) HeLa cells were transiently transfected with pBABE-puro mCherry-EGFP-LC3B plasmid and then untreated or treated with CA (50 μM) for 24 h. Representative images showing EGFP-LC3 and mCherry-LC3 puncta. (For interpretation of the references to color in this figure legend, the reader is referred to the web version of this article.) |
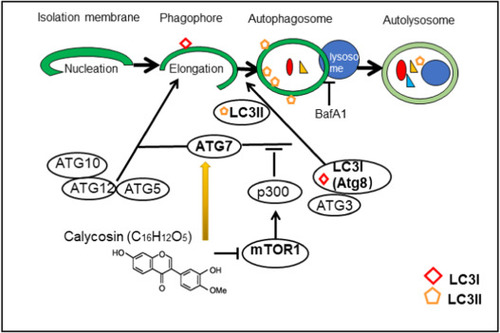
Graphical diagram representing the autophagy regulation mechanism of CA. Atg7 plays a crucial role in autophagy process, Atg7 functions as ATP-binding and catalytic sites of E1 activator proteins, activates two ubiquitin-like proteins, Atg8 and Atg12 during the formation of the autophagosomal membrane. CA stimulates autophagy via manipulating Atg7. |