
- Title
-
Identification of a novel series of hair-cell MET channel blockers that protect against aminoglycoside-induced ototoxicity
- Authors
- Kenyon, E.J., Kirkwood, N.K., Kitcher, S.R., Goodyear, R.J., Derudas, M., Cantillon, D.M., Baxendale, S., de la Vega de León, A., Mahieu, V.N., Osgood, R.T., Donald Wilson, C., Bull, J.C., Waddell, S.J., Whitfield, T.T., Ward, S.E., Kros, C.J., Richardson, G.P.
- Source
- Full text @ JCI Insight
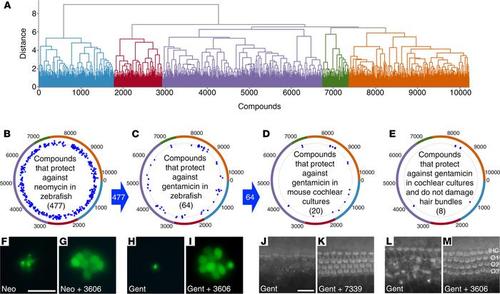
Screen of 10,240 Life Chemicals Diversity compounds in zebrafish larvae and mouse cochlear cultures. (A) Dendrogram of compounds grouped by broadly related structure into 5 clusters identified by color. (B–E) Polar scatterplots annotated with dendrogram clusters. Blue dots show “hit” compounds in each cluster obtained in each screen (see Supplemental Figure 1). Blue arrows between the plots indicate compounds passing the previous screen were used in the next. (F–M) Representative examples of neuromasts (F–I) and cochlear cultures (J–M) treated with antibiotic alone (F, H, J, and L) or antibiotic in the presence of one of the hit compounds (G, I, K, and M). Neuromasts (F–I) were labeled with YO-PRO-1 prior to incubation with neomycin alone (F), neomycin and UoS-3606 (G), gentamicin alone (H), or gentamicin and UoS-3606 (I). Cochlear cultures (J–M) were labeled with Texas red phalloidin after treatment with gentamicin alone (J and L) and gentamicin with UoS-7339 (K) or UoS-3606 (M). Hair bundles in K show damage; those in M are normal. Scale bars: 20 μm (J–M). |

Compounds protecting mammalian cochlear hair cells from gentamicin without visible damage to the hair bundles. (A–H) Graphs showing the numbers of surviving OHCs in a region of interest (ROIs) 20% from the basal end of the cochlea in cultures exposed to low-serum medium (LSM), LSM with 5 μM gentamicin, or LSM with 5 μM gentamicin and 50 μM of (A) UoS-962, (B) UoS-3606, (C) UoS-3607, (D) UoS-5247, (E) UoS-7691, (F) UoS-7692, (G) UoS-8052, and (H) UoS-9645. DMSO at 0.5% in all conditions. Each compound was tested on the following number of independent occasions alongside a control and 5 μM gentamicin condition: UoS-962 (n = 4), UoS-3606 (n = 4), UoS-3607 (n = 4), UoS-5247 (n = 4), UoS-7691 (n = 4), UoS-7692 (n = 6), UoS-8052 (n = 3), and UoS-9645 (n = 6); additionally, in some instances compounds were tested twice within 1 experiment. One-way ANOVA with Tukey’s multiple-comparison test revealed all compounds were protective, with numbers of OHCs in the presence of test compounds and gentamicin significantly different from cultures exposed to gentamicin alone. Numbers of OHCs in cultures incubated with gentamicin and UoS-9645 were significantly lower than those in cultures exposed to LSM alone. Symbols represent individual replicates. Each symbol represents numbers of OHCs in a mid-basal ROI from 1 culture. Error bars show standard deviation of the mean (SDM). *P < 0.05; **P < 0.01; ***P < 0.001; NS, no significant difference. Representative images of the ROI from cultures exposed to LSM with 5 μM gentamicin and 50 μM of each compound show the protection offered, with phalloidin-stained hair bundles clearly visible. Scale bar: 25 μm. |

UoS-5247 and UoS-8052 are cytotoxic at a concentration of 100 μM. (A–H) Representative images from the mid-basal ROI of Texas red phalloidin-stained cultures that were exposed to 100 μM of UoS-962 (A), UoS-3606 (B), UoS-3607 (C), UoS-5247 (D), UoS-7691 (E), UoS-7692 (F), UoS-8052 (G), and UoS-9645 (H) alone for 48 hours. UoS-5247 (D) and UoS-8052 (G) show widespread cell death. Images are representative of n = 2 experiments. UoS-8052 was selectively toxic to OHCs, whereas UoS-5247 killed both inner and outer hair cells. Scale bar: 25 μm. |

Compounds UoS-7692 and UoS-9645 do not block IK,neo. (A and B) Basolateral currents measured from mid-basal coil OHCs in response to a series of voltage steps from a holding potential of –84 mV before, during, and after extracellular exposure to 50 μM UoS-5247 (A) and 50 μM UoS-7692 (B). Schematic representation of the voltage-step protocol is shown below each of the current traces. Cell capacitances were 6.8 pF (A) and 7.0 pF (B). (C and D) Current-voltage curves measured from cells exposed to 50 μM UoS-5247 (C) and UoS-7692 (D) before, during, and after compound superfusion. (E and F) Average steady-state current-voltage curves of the 8 protective compounds at 50 μM. Currents normalized to steady-state control current at +46 mV for each cell. Cell numbers: UoS-962 (n = 2); UoS-3606 (n = 2); UoS-3607 (n = 2); UoS-5247 (n = 5); UoS-7691 (n = 4); UoS-7692 (n = 4); UoS-8052 (n = 5); UoS-9645 (n = 5). |
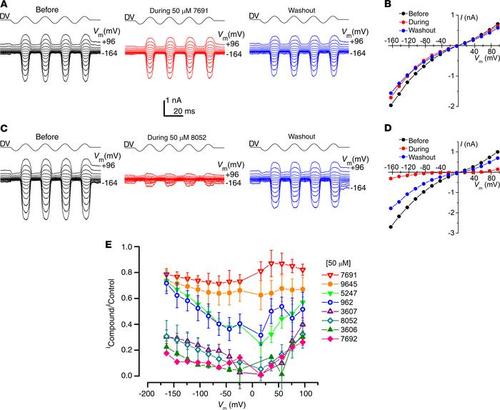
All 8 hit compounds block the MET channel to varying degrees. (A) MET currents recorded from an OHC before, during, and after extracellular exposure to 50 μM UoS-7691. Currents were recorded at membrane potentials ranging from –164 to +96 mV with channel opening and closing achieved by a sinusoidal stimulus delivered to the fluid jet (driver voltage, DV). (B) Current-voltage curves before, during, and after extracellular exposure to 50 μM UoS-7692 derived from currents shown in A. Cell capacitance was 8.2 pF. (C) MET currents from another OHC before, during, and after exposure to 50 μM UoS-8052. (D) Current-voltage curves derived from the currents shown in C. Cell capacitance was 7.0 pF. (E) Average fractional block curves (mean ± SEM) for all 8 compounds at 50 μM. Cell numbers: UoS-962 (n = 7); UoS-3606 (n = 4); UoS-3607 (n = 4); UoS-5247 (n = 4); UoS-7691 (n = 3); UoS-7692 (n = 3); UoS-8052 (n = 4); UoS-9645 (n = 9). |

Dose-response function for gentamicin protection with UoS-7692 and protection from tobramycin and kanamycin by UoS-7692. (A) Dose-response graph showing average number of OHCs in mid-basal ROI from cultures exposed to LSM with 5 μM gentamicin and 3–100 μM UoS-7692 for 48 hours. Graph fitted with equation 1. EC50 value of UoS-7692 is 8.1 μM. Number of cultures: 3 μM (n = 3); 10 μM (n = 5); 30 μM (n = 3); 50 μM (n = 6); 100 μM (n = 3). Error bars show SEM. (B) Micrographs of mid-basal region of cochlear cultures incubated for 48 hours in 20 μM tobramycin (left) or 75 μM kanamycin (right) without (top) or with (bottom) 50 μM UoS-7692. Scale bar: 25 μm. Quantification of OHC survival showed protection from tobramycin- and kanamycin-induced hair-cell death. One-way ANOVA with Tukey’s multiple-comparison test. **P < 0.01; ***P < 0.001. Experiments were performed on 3 independent occasions. Symbols represent data from individual cells. Error bars show SDM. |

Antimicrobial activity of gentamicin is unaffected by the presence of UoS-7692. Box-and-whisker plots of ATP luminescence as a measure of bacterial viability in Staphylococcus aureus, Klebsiella pneumoniae, and Pseudomonas aeruginosa grown in 2.2 μM gentamicin in the presence or absence of 11 μM UoS-7692. There was no change in the bactericidal activity of gentamicin in the presence of UoS-7692. UoS-7692 was tested with 3 technical replicates and 3 independent biological replicates. Midline = median, boxes = IQR, whiskers = an additional 1.5 × IQR; replicates are shown as open circles with biological replicates grouped by color. Staphylococcus aureus (t = 1.55, df = 14, P = 0.143), Klebsiella pneumoniae (t = 1.44, df = 13, P = 0.175), and Pseudomonas aeruginosa (t = 1.71, df = 14, P = 0.11) using a linear mixed-effects model. |
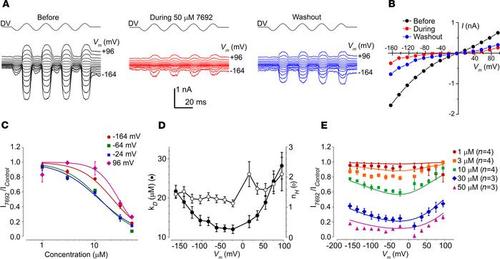
UoS-7692 is a strong MET channel blocker at 50 μM. (A) MET currents recorded from an OHC before, during, and after extracellular exposure to 50 μM UoS-7692. Currents elicited by sinusoidal fluid-jet stimulation (DV) and recorded at membrane potentials ranging from –164 to +96 mV. (B) Current-voltage curves before, during, and after extracellular exposure to 50 μM UoS-7692. Cell capacitance was 7.4 pF. (C) Average dose-response curves for MET channel block by UoS-7692, fitted to equation 2. For clarity, data for only 4 selected membrane potentials are shown. (D) KD and Hill coefficient from dose-response curves fitted to data recorded at each membrane potential. (E) Average fractional block curves showing current during UoS-7692 superfusion relative to control current at each membrane potential. Curves are fits to a 2-barrier 1 binding-site model (equation 3). Fit parameters: ΔE 0.0 kT (95% CI –1.2 to 1.2 kT); Eb –17.0 kT (95% CI –18.3 kT to –15.7 kT); δb 0.69 (95% CI 0.51 to 0.87); z 0.73 (95% CI +0.72 to +0.74); nH 1.45 (95% CI 1.34 to 1.56). Number of OHCs in B–D: 1 μM (n = 4); 3 μM (n = 4); 10 μM (n = 4); 30 μM (n = 3); 50 μM (n = 3); error bars show SEM. |

UoS-7692 reduces GTTR loading in cochlear hair cells. Representative micrographs of GTTR fluorescence in cochlear cultures incubated with DMSO (A) and UoS-7692 (B) prior to the addition of GTTR. Scale bar: 25 μm. (C) Comparison of GTTR fluorescence levels in AU by 2-tailed unpaired t test shows a reduction in GTTR loading in cultures treated with UoS-7692 (***P < 0.001). Symbols represent individual OHC fluorescence levels (10 cells from 3 control and 4 UoS-7692–treated cultures: different colors indicate the 3 independent experimental repeats). Error bars show SDM. |

UoS-7692 preserves larval movement in neomycin-treated zebrafish. (A) Box-and-whisker plots showing movement of 5 dpf zebrafish larvae after treatment with E3 medium, 6.25 μM neomycin, or 25 μM UoS-7692 and 6.25 μM neomycin, followed by washout. Circles show individual larvae with independent experiments grouped by color (n = 3). (B) Images of example neuromasts labeled with YO-PRO-1 after treatment with E3 medium (top), 6.25 μM neomycin (middle), or 25 M UoS-7692 and 6.25 μM neomycin (bottom) after behavioral testing. Scale bar: 20 μm. (C) Box-and-whisker plots showing movement of 5 dpf zebrafish after treatment with either E3 medium or 25 μM UoS-7692 alone followed by washout. Circles show individual larvae with independent experiments grouped by color (n = 4). Black line shows median, gray boxes span the IQR, and whiskers extend over points within additional 1.5 × IQR. Neomycin compared with control larvae P = 0.029, neomycin and UoS-7692 compared with control larvae P = 0.3947, neomycin and UoS-7692 compared with neomycin alone larvae P = 0.0153 (Dunn’s post hoc tests). UoS-7692 alone compared with control larvae t = 0.552, df = 126, P = 0.58 using a 2-sample t test. *P < 0.05. |

Transtympanic injection of UoS-7692 protects OHCs from systemic kanamycin treatment. (A–L) Assessment of OHC-bundle morphology with phalloidin staining in regions 40% (A, B, G, and H), 60% (C–D, I, and J), and 80% (E, F, K, and L) from the cochlear apex in mice receiving transtympanic injection of UoS-7692 in 1 ear (A, C, E, G, I, and K) and no injection in the opposite ear (B, D, F, H, J, and L), followed by systemic furosemide/kanamycin. Mice were maintained for either 2 (A–F) or 9 (G–L) days. In UoS-7692–treated ears after 2 days, there was minimal or no OHC loss in all regions; in untreated ears, OHC loss was extensive, particularly in the 60% and 80% regions. In UoS-7692–treated ears after 9 days, some OHC loss was observed in the 60% region (I) and total loss seen in the 80% region (K); in untreated ears, there was total loss of OHCs in all regions (H, J, and L). Scale bar: 20 μm. (M) Graphs comparing OHC numbers in cochleae of noninjected (red symbols) and injected (brown and blue symbols) ears of mice 2 days after unilateral transtympanic application of 5% DMSO (brown symbols) or 50 mM UoS-7692 in 5% DMSO (blue symbols), followed by systemic furosemide/kanamycin (groups 1 and 2) or no treatment (group 3). Numbers of mice: group 1 (n = 5), group 2 (n = 9), group 3 (n = 2). OHCs were counted in 140 μm length regions located 40%, 60%, and 80% from the cochlear apex. UoS-7692 provided significant protection in all 3 regions (2-way ANOVA with matched pairs design between cochleae from the same animal, with Šidák’s multiple-comparison test between injected and noninjected ears. ***P < 0.001). Scale bar: 20 μm. Error bars show SDM. |

Transtympanic injection of UoS-7692 reduces kanamycin-induced hearing loss in mice. (A) ABR thresholds shifts from baseline (0 dB) measured 9 days after bilateral trans-tympanic injection (BTTI) of 5% DMSO (black circles, black line), 2 days after BTTI of 50 mM UoS-7692 (light-green diamonds, dashed line), and 9 days after BTTI of 50 mM UoS-7692 (dark-green diamonds, solid line). UoS-7692 induced significant temporary threshold shifts at 2 days, which were resolved by 9 days (1-way ANOVAs for click and individual pure-tone frequencies with Dunnett’s multiple-comparison test between UoS-7692 at 2 and 9 days and DMSO at 9 days). Significance levels for differences between UoS-7692 at 2 days and DMSO at 9 days are indicated by light-green asterisks. (B) ABR threshold shifts measured 9 days after BTTI of 5% DMSO (black circles), 2 days (light-blue squares, dashed line), 9 days (dark-blue squares, solid line) after 50 mM UoS-7692 BTTI followed by furosemide/kanamycin exposure, and 2 days after furosemide/kanamycin exposure without BTTI (red triangles). BTTI of UoS-7692 significantly reduced threshold shifts 9 days after furosemide/kanamycin exposure for clicks and pure-tone frequencies of 12 and 18 kHz (1-way ANOVAs for click and individual pure-tone frequencies with Dunnett’s multiple-comparison test between the 2-day furosemide/kanamycin condition and the other 3 conditions). Significance levels for differences between Furos/Kana at 2 days and UoS-7692 + Furos/Kana at 2 and 9 days are indicated by light- and dark-blue asterisks, respectively; significance levels for differences between Furos/Kana at 2 days and DMSO at 9 days are indicated by black asterisks. *P < 0.05; **P < 0.01; ***P < 0.001. N numbers are shown in the key. Error bars show SEM. |

Structures and properties of the Diversity Set hits. Table illustrating structures and properties of the 8 compounds from the Life Chemicals Diversity Set that protect mouse OHCs from exposure to gentamicin in vitro. Names of compounds in the first column are colored according to dendrogram group shown in Figure 1. The molecules and their substructure classification are based on a working model that assumes likely commonality in the mode of binding to the channel. Properties shown are molecular weight (MW), lipophilicity (cLogP and cLogD), calculated acid dissociation constant (pKa), and fractional (%) block of MET current by 50 μM of compound at a holding potential of –164 mV. The basic N is indicated with an asterisk. Moieties outlined are piperidine (blue), piperazine (green), benzimidazole (red), metachlorophenyl, pyridine (orange for UoS-5247 and UoS-962, respectively), and furan (purple). Lipophilic aromatic moiety for UoS-7692, UoS-8052, UoS-3607, UoS-3606, UoS-962, and UoS-9645 is outlined in magenta and lipophilic side chain of UoS-5247 is outlined in maroon. |