
- Title
-
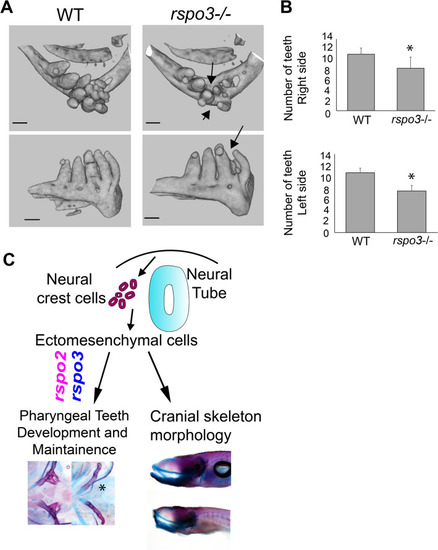
Synergistic roles of Wnt modulators R-spondin2 and R-spondin3 in craniofacial morphogenesis and dental development
- Authors
- Alhazmi, N., Carroll, S.H., Kawasaki, K., Woronowicz, K.C., Hallett, S.A., Macias Trevino, C., Li, E.B., Baron, R., Gori, F., Yelick, P.C., Harris, M.P., Liao, E.C.
- Source
- Full text @ Sci. Rep.

High resolution gene expression analysis detected dynamic spatiotemporal localization of EXPRESSION / LABELING:
|

RNAscope gene expression analysis of |
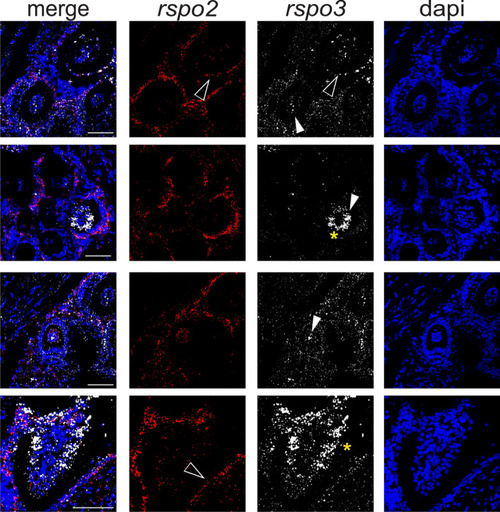
|
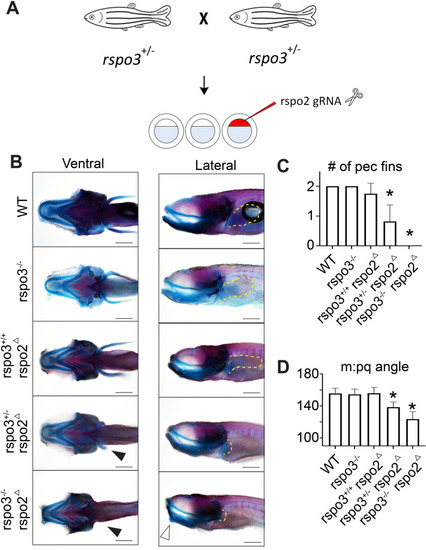
Synergistic effect of PHENOTYPE:
|

Synergistic effect of PHENOTYPE:
|
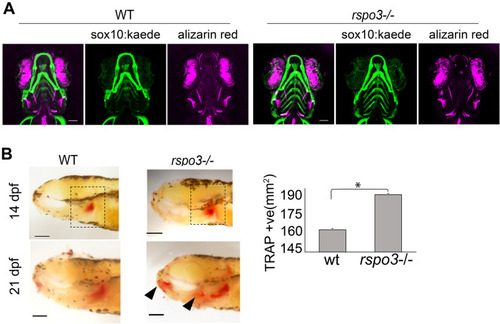
EXPRESSION / LABELING:
PHENOTYPE:
|
PHENOTYPE:
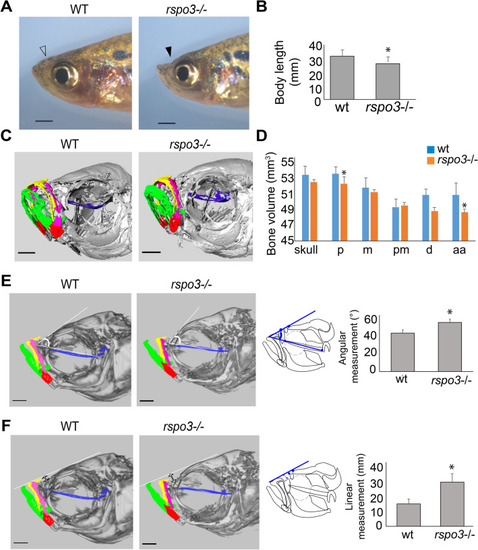
|
Adult PHENOTYPE:
|