IMAGE

Figure 2

ID
ZDB-IMAGE-210319-35
Source
Figures for Alhazmi et al., 2021
Image
Figure Caption

Figure 2

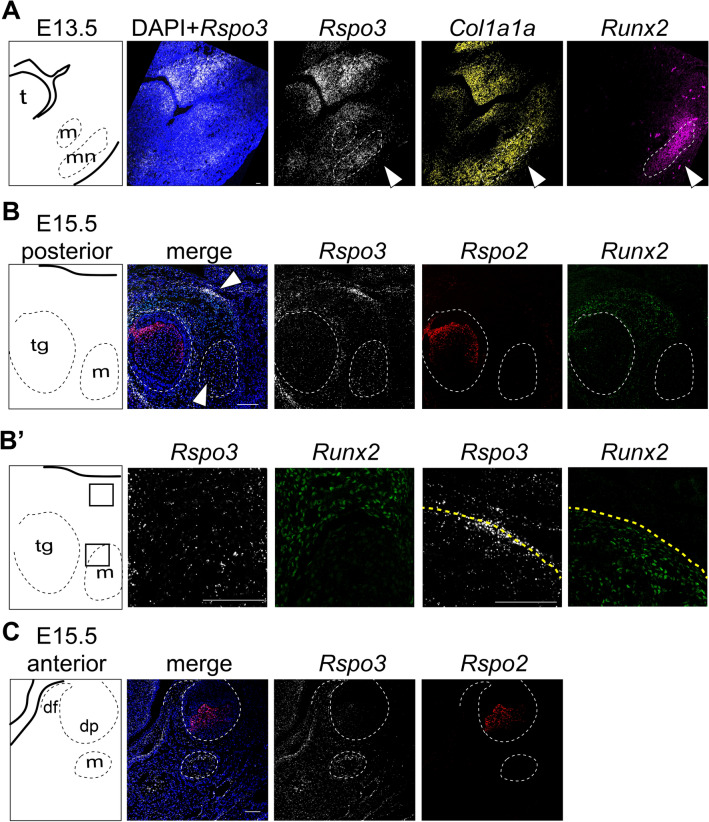
RNAscope gene expression analysis of Rspo2 and Rspo3 in mouse embryos. Coronal sections of wild-type mouse embryos at E13.5 and E15.5. Labeled schematic at left. (A) RNAscope revealed diffuse expression of Rspo3 throughout the cranial mesenchyme at E13.5. Col1a1 in situ hybridization and Runx2 immunofluorescence were used to identify osteogenic precursor cells and Rspo3 expression was detected within these cells. Of particular note is Rspo3 expression within Meckel’s cartilage (m) and the developing mandible (arrow; mn). (B) At E15.5, Rspo3 expression is detected diffusely thorough the mesenchyme, including in Meckel’s cartilage (m) and within osteogenic precursor cells (co-expressed with Runx2). Rspo2 expression is isolated to discrete cells within the developing tooth germ (tg). (B’) Higher magnification images (boxes depict location) of Rspo3 and Runx2 co-expression. (C) Within the developing molar at E15.5, Rspo2 and Rspo3 transcripts were detected in distinct non-overlapping regions, with Rspo3 expression in Meckel’s cartilage (m) and the dental follicle (df), while Rspo2 is expressed exclusively within the dental pulp (dp). Scale bar: 100 μm.

Acknowledgments
This image is the copyrighted work of the attributed author or publisher, and ZFIN has permission only to display this image to its users. Additional permissions should be obtained from the applicable author or publisher of the image. Full text @ Sci. Rep.