
- Title
-
Heparan sulfate proteoglycan expression in the regenerating zebrafish fin
- Authors
- Keil, S., Gupta, M., Brand, M., Knopf, F.
- Source
- Full text @ Dev. Dyn.
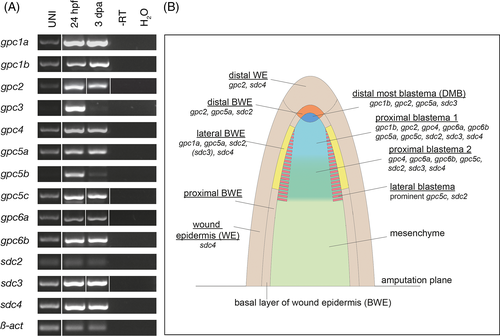
RT-PCR and regenerate domains at 3 dpa displaying HSPG expression. A, RT-PCR. UNI, uninjured. B, HSPG expression scheme |
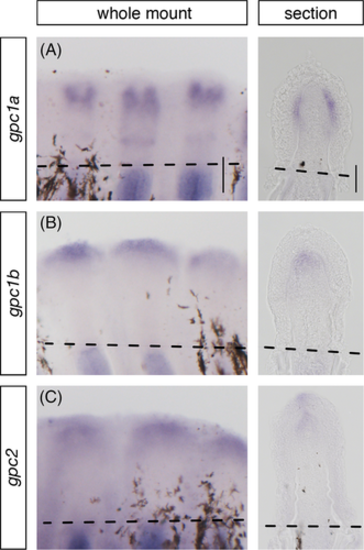
Expression pattern of gpc1a, gpc1b, and gpc2 in 3 dpa fin regenerates. Three neighboring fin rays of the same regenerate are shown on the left (whole mount). Scale bar 100 μm. The longitudinal section view can be seen on the right. Scale bar 50 μm. A, gpc1a expression (n = 4/5 fins), B, gpc1b expression (n = 4/5 fins), C, gpc2 expression (n = 4/4 fins). The black dotted line demarcates the amputation plane
EXPRESSION / LABELING:
|
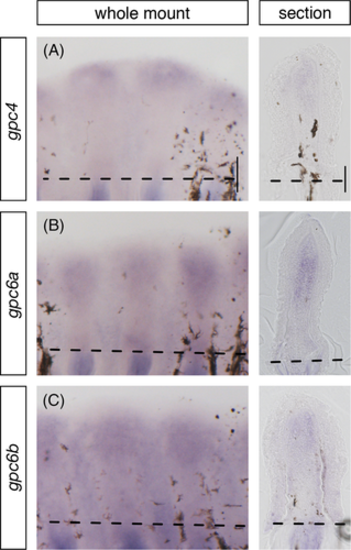
Expression pattern of gpc4, gpc6a, and gpc6b in 3 dpa fin regenerates. Three neighboring fin rays of the same regenerate are shown on the left (whole mount). Scale bar 100 μm. The longitudinal section view is shown on the right. Scale bar 50 μm. A, gpc4 expression (n = 5/5 fins) B, gpc6a expression (n = 5/5 fins), C, gpc6b expression (n = 5/5 fins). The black dotted line demarcates the amputation plane
EXPRESSION / LABELING:
|
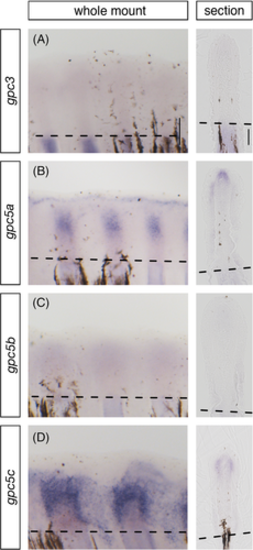
Expression pattern of gpc3, gpc5a, gpc5b, and gpc5c in 3 dpa fin regenerates. Three neighboring fin rays of the same regenerate are displayed on the left (whole mount). Scale bar 100 μm. The longitudinal section view can be seen on the right. Scale bar 50 μm. A, gpc3 expression (n = 5/5 fins), B, gpc5a expression (n = 4/4 fins), C, gpc5b expression (n = 4/4 fins), D, gpc5c expression (n = 6/6 fins). The black dotted line demarcates the amputation plane
EXPRESSION / LABELING:
|
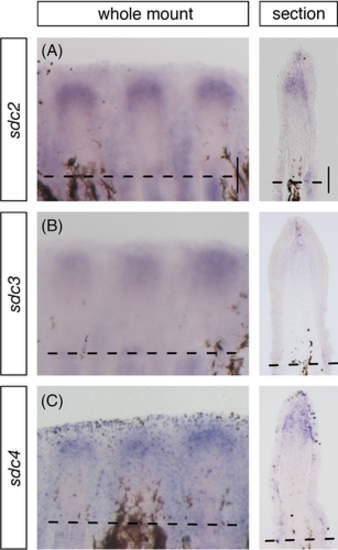
Expression pattern of sdc2, sdc3, and sdc4 in 3 dpa fin regenerates. Two to three neighboring fin rays of the same regenerate are depicted on the left (whole mount). Scale bar 100 μm. The longitudinal section view is shown on the right. Scale bar 50 μm. A, sdc2 expression (n = 5/5 fins), B, sdc3 expression (n = 3/3 fins), C, sdc4 expression (n = 5/5 fins). The black dotted line demarcates the amputation plane
EXPRESSION / LABELING:
|
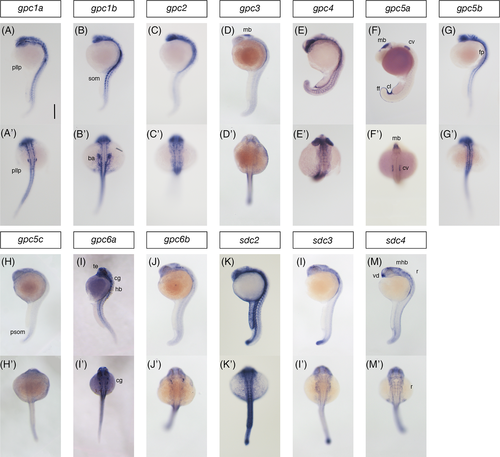
Prim-5 embryo staining controls for in situ probes. 24 hpf embryos are shown in lateral (A-M) and dorsal (A′-M′) views. Embryos in E/E′ and F/F′ are slightly younger. Scale bar 250 μm. pllp, posterior lateral line primordium; som, somites; ba, branchial arch; mb, midbrain; ov, otic vesicle; cl, cloaca; ff, fin fold; fp, floor plate; psom, posterior somites; te, telencephalon; cg, cranial ganglion; vd, ventral diencephalon; mhb, midbrain hindbrain boundary; r, rhombomeres
|