
- Title
-
Circulating Tumor Cells Characterization Revealed TIMP1 as a Potential Therapeutic Target in Ovarian Cancer
- Authors
- Abreu, M., Cabezas-Sainz, P., Alonso-Alconada, L., Ferreirós, A., Mondelo-Macía, P., Lago-Lestón, R.M., Abalo, A., Díaz, E., Palacios-Zambrano, S., Rojo-Sebastian, A., López-López, R., Sánchez, L., Moreno-Bueno, G., Muinelo-Romay, L.
- Source
- Full text @ Cells
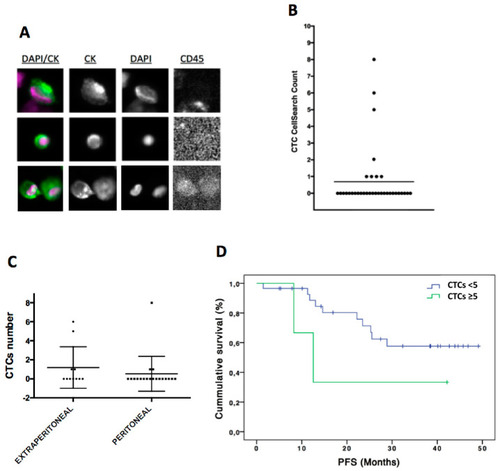
Figure 1 CTCs enumeration by CellSearch system in ovarian cancer patients. (A) CTCs images obtained using CellSearch system (round-oval, DAPI+, CD45− and CKs+ cells were considered as CTCs). (B) CTCs count in ovarian cancer patients. (C) CTCs count in patients with extra-peritoneal (n = 11) and peritoneal metastasis (n = 19). (D) Kaplan-Meier analysis for PFS grouping patients according to the CTCs count (CTCs number < 5 CTCs versus CTCs number ≥ 5 CTCs). For CTCs < 5 group n = 35 while for CTC ≥ 5 CTCs n = 3. p = 0.18 according to log-Rank test. PFS, progression free survival. |
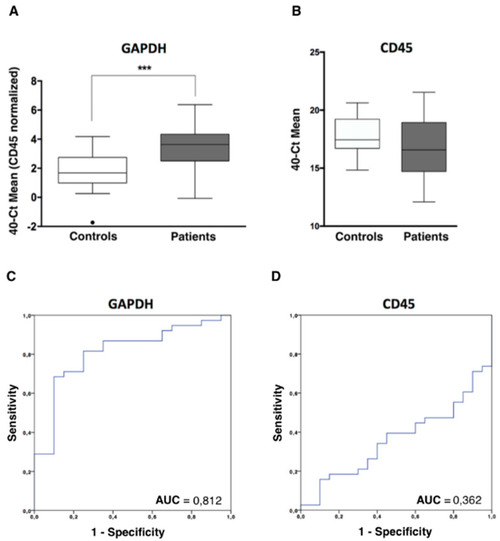
CTCs analysis in ovarian cancer patients by RT-qPCR. (A) GAPDH expression levels, normalized by CD45, in the CTCs fraction of patients and controls, analysed by RT-qPCR (Mann-Whitney U Test, *** p < 0.001). (B) CD45 expression levels, in the CTCs fraction of patients and controls, analyzed by RT-qPCR. (C,D) Power to discriminate patients and controls based on GAPDH and CD45 expression levels, analysed by ROC curves. AUC, area under the curve. |
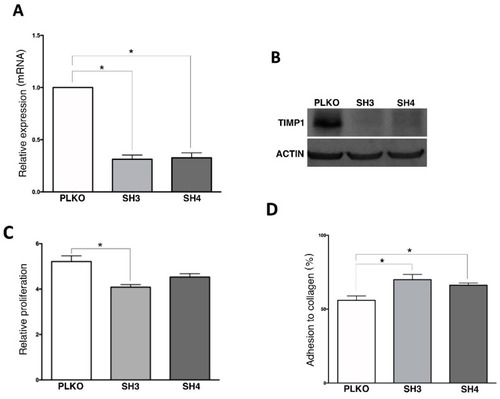
Figure 4 In vitro effect of TIMP1 knock-down on SKOV3 cell line. (A) TIMP1 expression levels analyzed by RT-q-PCR in the control and the TIMP1 knocked-down cell lines. (B) TIMP1 protein levels analyzed by Western Blot in the control and the TIMP1 knocked-down cell lines. (C,D) Results of the Alamar-blue assay to measure cell proliferation and adhesion to collagen matrix. In all experiments, SKOV3_PLKO was the control cell line and TIMP1 knocked-down cell lines were SKOV3_SH3 and SKOV3_SH4. nreplica = 3 for all the experiments. * p < 0.05. |
In vitro effect of TIMP1 knock-down on SKOV3 cell line. (A) TIMP1 expression levels analyzed by RT-q-PCR in the control and the TIMP1 knocked-down cell lines. (B) TIMP1 protein levels analyzed by Western Blot in the control and the TIMP1 knocked-down cell lines. (C,D) Results of the Alamar-blue assay to measure cell proliferation and adhesion to collagen matrix. In all experiments, SKOV3_PLKO was the control cell line and TIMP1 knocked-down cell lines were SKOV3_SH3 and SKOV3_SH4. nreplica = 3 for all the experiments. * p < 0.05. |
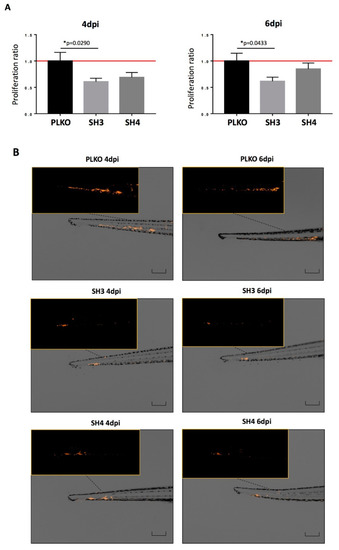
Effect of TIMP1 knock-down in SKOV3 proliferation in zebrafish embryos. (A) Representative images of the injected embryos with the different conditions of the TIMP1 silenced cells (SH3 and SH4) and the control cell line (PLKO) at 4 dpi and 6 dpi compared to 1 dpi. Main images are a superposition of a fluorescence image and a bright field image of the same embryo. Fluorescence images are a magnification of the areas marked in the main image. Scale = 250 µm. (B) Normalized tumor growth at 4 dpi (left panel): SKOV3_PLKO = 1.00, SKOV3_SH3=0.6072, SKOV3_SH4=0,6898; and 6 dpi (right panel): SKOV3_PLKO = 1.00, SKOV3_SH3 = 0.6155, SKOV3_SH4 = 0.8484 (nreplica = 15 embryos/condition, ntotal = 45 embryos/condition; * p < 0.05 according to two-sided T-test). |
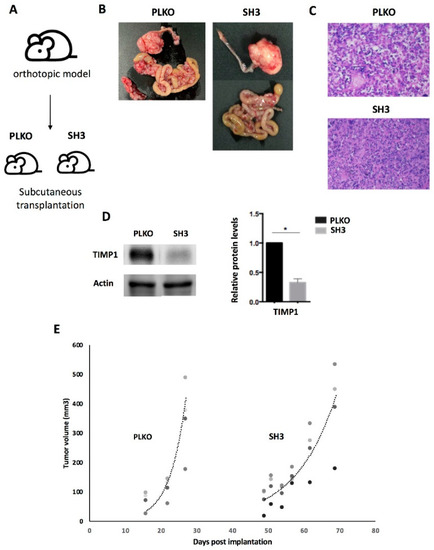
Effect of TIMP1 knock-down in SKOV3 proliferation in a mice model. (A) Representative scheme of the assay. The TIMP1 silenced cells (SH3) and the control cell line (PLKO) were injected in the ovary of SCID mice and the generated tumors amplified subcutaneously in the flank of three female SCID mice per group. (B) Macroscopic image of tumor generated orthotopically. (C) Representative images of hematoxylin-eosin staining of tumors generated in the subcutaneous model (objective 10x). (D) Western blot results for TIMP1 protein levels in tumors generated by SKOV3_PLKO and SH3 cell lines. Actin was used as normalizer. (E) Dynamic of tumor growth after subcutaneous transplantation, which was slower in the TIMP1 silenced cell line. nreplica = 3 for the two experimental groups. * p < 0.05. |