
Image
|
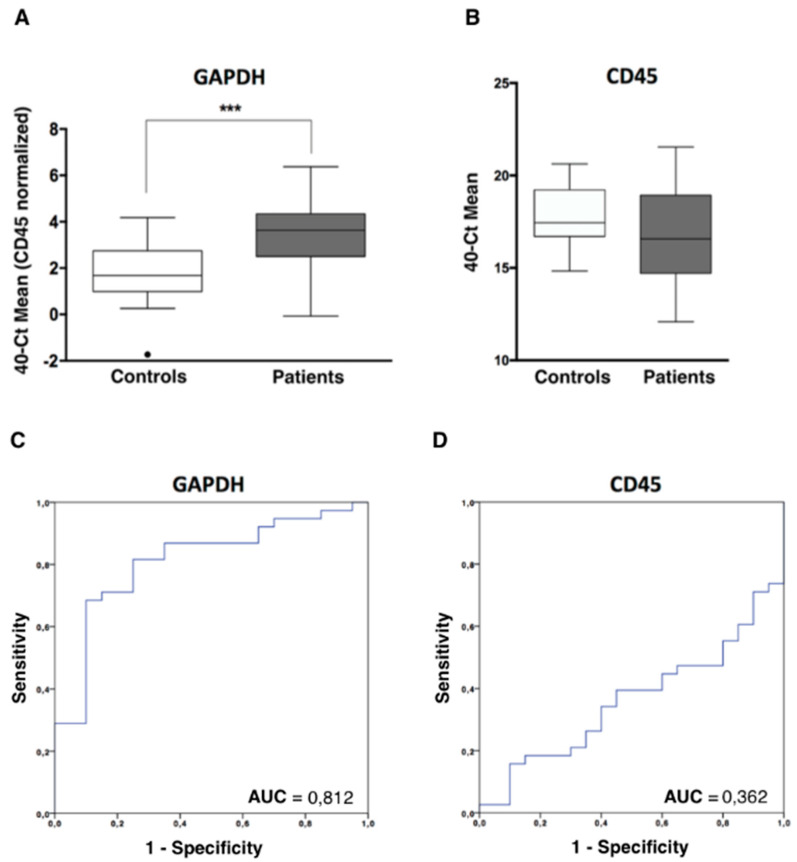
Figure Caption
Figure 2 CTCs analysis in ovarian cancer patients by RT-qPCR. (A) GAPDH expression levels, normalized by CD45, in the CTCs fraction of patients and controls, analysed by RT-qPCR (Mann-Whitney U Test, *** p < 0.001). (B) CD45 expression levels, in the CTCs fraction of patients and controls, analyzed by RT-qPCR. (C,D) Power to discriminate patients and controls based on GAPDH and CD45 expression levels, analysed by ROC curves. AUC, area under the curve.
Acknowledgments
This image is the copyrighted work of the attributed author or publisher, and
ZFIN has permission only to display this image to its users.
Additional permissions should be obtained from the applicable author or publisher of the image.
Full text @ Cells