
- Title
-
Induction of ER Stress in Acute Lymphoblastic Leukemia Cells by the Deubiquitinase Inhibitor VLX1570
- Authors
- Pellegrini, P., Selvaraju, K., Faustini, E., Mofers, A., Zhang, X., Ternerot, J., Schubert, A., Linder, S., D Arcy, P.
- Source
- Full text @ Int. J. Mol. Sci.
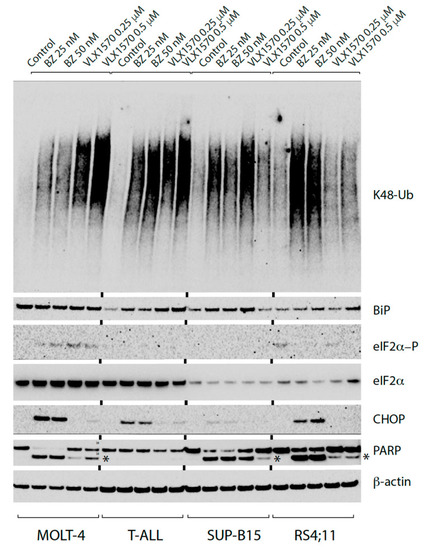
Accumulation of polyubiquitinated proteins and induction of endoplasmic reticulum (ER) stress in acute lymphoblastic leukemia (ALL) cells exposed to bortezomib or VLX1570. T-ALL (MOLT-4 and T-ALL) and B-ALL (SUP-B15 and RS4;11) cells were exposed to bortezomib (BZ), VLX1570 or vehicle (0.5% DMSO; control) for 9 h, and extracts were prepared and subjected to immunoblotting using the indicated antibodies. The antibody to polyubiquitin detects K48-linked chains; Poly (ADP-ribose) polymerase (PARP) cleavage fragments are indicated with an asterix. |
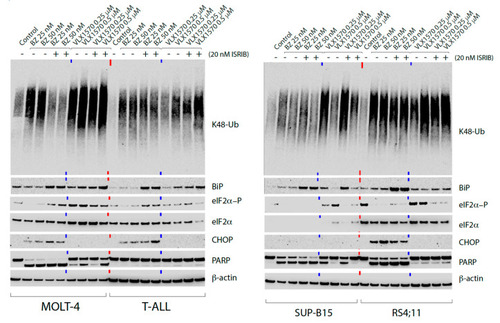
Effect of Integrated Stress Response Inhibitor (ISRIB) on endoplasmic reticulum (ER) stress induced by bortezomib and VLX1570. Cells were exposed to bortezomib, VLX1570, or vehicle (0.5% DMSO) for 9 h. Extracts were prepared and subjected to immunoblotting using the indicated antibodies. |
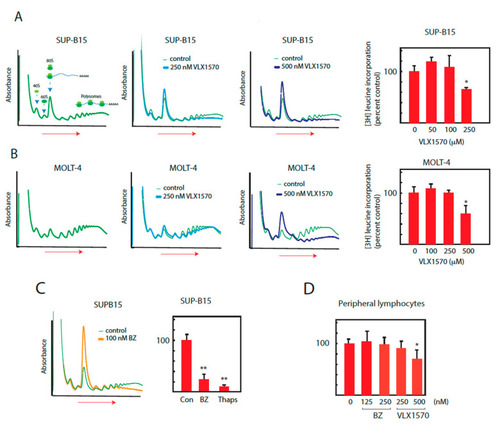
Suppression of translation by bortezomib and VLX1570. Cells were exposed to bortezomib or VLX1570, and ribosomes and polysomes were fractionated using sucrose gradient centrifugation. Incorporation of [3H]-leucine into acid precipitable material was measured after 6 h of drug exposure. (A,B) SUP-B15 or MOLT-4 cells were exposed to VLX1570 for 6 h and lysates were prepared in the presence of RNAase inhibitors and cycloheximide (100 μg/mL) and fractionated by sucrose gradient sedimentation (left to right). Absorbance (A280) was monitored during collection. The dose response of [3H]-leucine incorporation into acid precipitable material was determined after 6 h of drug exposure ([3H]-leucine was added during the last hour). Mean values ± S.D., * p < 0.05 Student′s t-test. (C) SUP-B15 cells were exposed to bortezomib (BZ) and lysates were fractionated by sucrose gradient sedimentation (left to right) and A280 monitored during collection. [3H]-leucine incorporation into acid precipitable material was measured after 6 h exposure to 100 nM bortezomib or 10 µM thapsigargin. Mean values + S.D., ** p < 0.01, Student′s t-test. (D) Peripheral lymphocytes were exposed to VLX1570 for 6 h and [3H]-leucine incorporation into acid precipitable material was determined. Mean values ± S.D., * p < 0.05, Student′s t-test. |
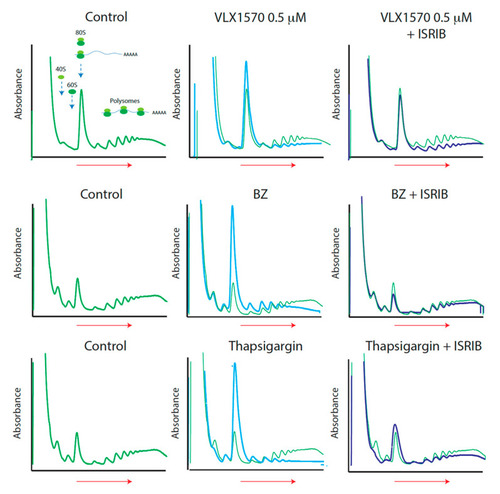
Different sensitivities of drug-suppressed translation to the eukaryotic translation initiation factor 2 subunit beta (eIF2B) activator integrated stress response inhibitor (ISRIB). Cells were exposed to 0.5 µM VLX1570, 100 nM bortezomib, or 10 μM thapsigargin in the presence or absence of 0.2 μM ISRIB for 6 h. Lysates were prepared as subjected to sucrose gradient sedimentation (left to right). Absorbance (A280) was monitored during collection. |
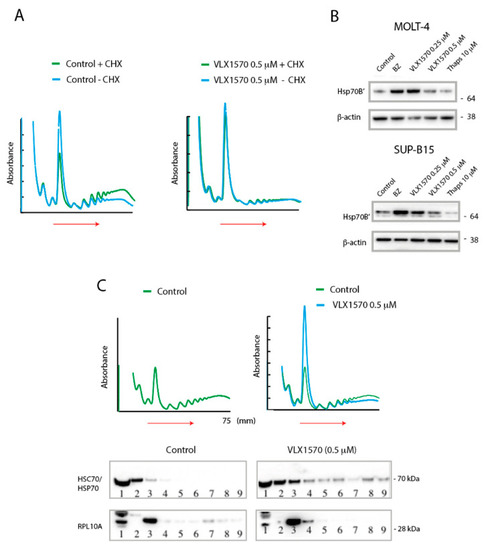
Evidence for impaired translational elongation. (A) SUP-B15 cells were exposed to VLX1570 or vehicle and extracts fractionated by sucrose gradient centrifugation. Extracts were prepared in the presence or absence of cycloheximide (CHX) as indicated. (B) MOLT-4 or SUP-B15 cells were exposed to the indicated compounds for 6 h, and cell extracts were processed for immunoblotting. Bortezomib (BZ) was used at 50 nM. (C) SUP-B15 cells were exposed to VLX1570 or vehicle and extracts fractionated by sucrose gradient centrifugation. Fractions were collected and analyzed by immunoblotting using antibodies to Rpl10A (a component of the 60S ribosome subunit) or HSC70/HSP70 proteins. |
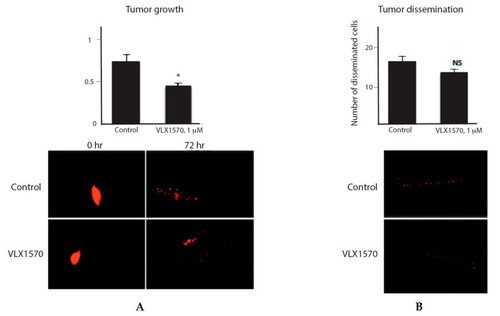
Antineoplastic activity in the zebrafish embryo model. (A, left) Assessment of tumor cell growth in zebrafish embryos. Embryos (n = 20) were injected with labeled ALL cells and fluorescence determined after injection (basal level) and after 72 h (average ± S.E.M.). (B, right) Assessment of tumor dissemination in zebrafish embryos. Embryos (n = 20) were injected with labeled ALL cells and labeled cells in dorsal regions were recorded after 72 h (average ± S.E.M.). Statistical significance was calculated by t-test; * p < 0.05. Scale bar 200 µm |