FIGURE SUMMARY
Title

Pcgf1 Regulates Early Neural Tube Development Through Histone Methylation in Zebrafish

Authors
Li, X., Ji, G., Zhou, J., Du, J., Li, X., Shi, W., Hu, Y., Zhou, W., Hao, A.
Source
Full text @ Front Cell Dev Biol

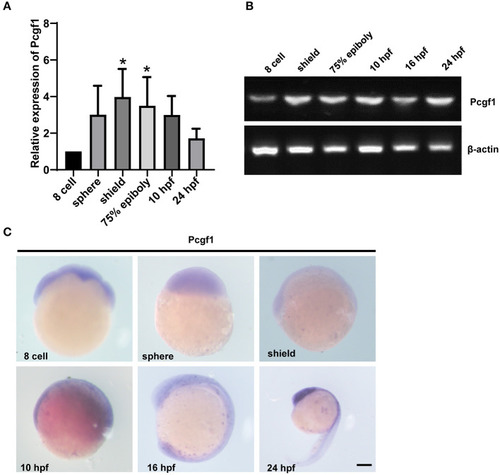
The expression pattern of Pcgf1 during zebrafish embryonic development. (A,B) qPCR and RT-PCR were used to analyze the expression level of the Pcgf1 during zebrafish developmental stages, ranging from eight cells to 24 hpf. Pcgf1 is maternally expressed, increased at sphere phase, and continued to 24 hpf *P < 0.05. (C) The expression of Pcgf1 in zebrafish was determined by whole-mount in situ hybridization at the indicated stages (from eight cells to 24 hpf). Scale bar: 200 μm.

EXPRESSION / LABELING:
Gene:
Fish:
Anatomical Terms:
Stage Range: 8-cell to Prim-5

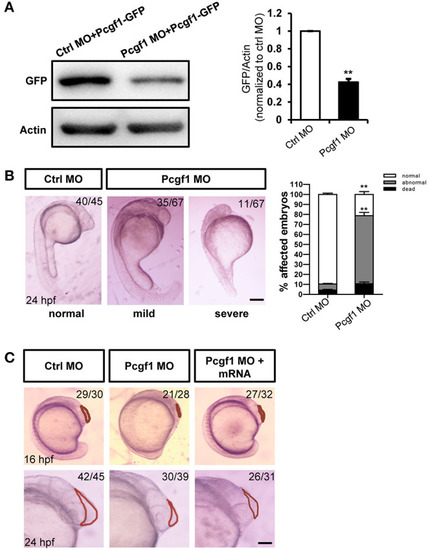
Zebrafish embryos displayed telencephalic malformations after knockdown of Pcgf1. (A) Western blot analysis of the specificity and efficiency of Pcgf1 knockdown in zebrafish at 24 hpf. The Pcgf1 MO could efficiently knockdown the expression of Pcgf1 because the expression of GFP is downregulated. The bar graphs clarified the relative level of GFP/actin expression for at least three independent experiments. Values represent mean ± SEM. **P < 0.01. (B) Compared with the embryos in the control group, the development of neural tube in the experimental group (MO) had obvious defects. The mild phenotype consisted of a smaller head and a shorter body axis, and the severe phenotype had a partial head area deletion. Bar graphs show the statistical data for the embryo numbers. **P < 0.01. (C) Morphology of Pcgf1 morphants at 16 and 24 hpf. The Pcgf1 MO group showed that the area of the telencephalon decreased or even disappeared compared with the control group. Co-injections of human Pcgf1 mRNA with Pcgf1 MO could partially rescue the telencephalic defects induced by Pcgf1 MO. Red line point to the telencephalic region. Scale bar: 200 μm.

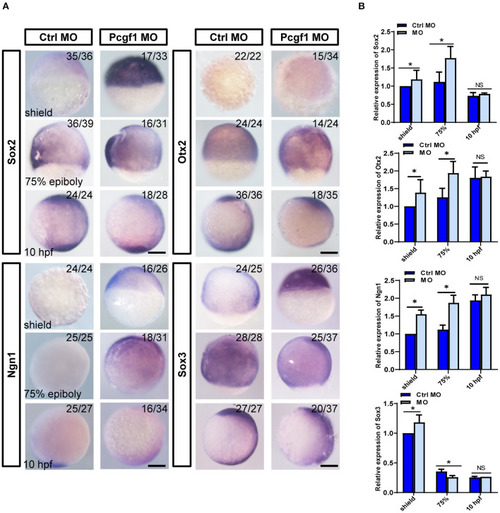
Effect of Pcgf1 on neural induction phase. (A) The expression levels of Sox2, Otx2, Ngn1, and Sox3 were detected by whole-mount in situ hybridization at neural induction phase (shield phase, 75% epiboly phase, and 10 hpf). Scale bar: 200 μm. (B) The expression of Sox2, Otx2, Ngn1, and Sox3 was analyzed by qPCR, and the expression of β-actin gene represented internal controls. Data represent the mean of at least three independent experiments ± SEM, *P < 0.05 vs. control MO.

EXPRESSION / LABELING:
Genes:
Fish:
Knockdown Reagent:
Anatomical Term:
Stage Range: Shield to Bud
PHENOTYPE:
Fish:
Knockdown Reagent:
Observed In:
Stage Range: Shield to 75%-epiboly

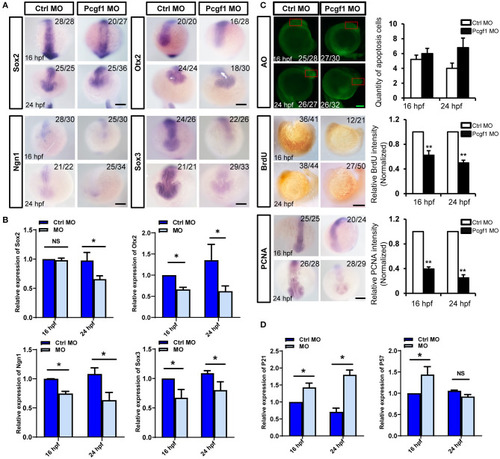
Effect of Pcgf1 on neural stem cells (NSCs) in neural tubes. (A) The expression levels of Sox2, Otx2, Ngn1, and Sox3 were detected by whole-mount in situ hybridization at self-renewal phase of NSCs (16 and 24 hpf). Scale bar: 200 μm. (B) The expression of Sox2, Otx2, Ngn1, and Sox3 was analyzed by qPCR, and the expression of β-actin gene represented internal controls. Data represent the mean of at least three independent experiments ± SEM, *P < 0.05 vs. control MO. (C) Acridine orange staining was used to detect apoptosis at 16 and 24 hpf; BrdU labeling of control MO and Pcgf1 MO-injected embryos at 16 and 24 hpf. The expression of PCNA was detected by whole-mount in situ hybridization. Data represent the mean of at least three independent experiments ± SEM, **P < 0.01 vs. control MO. (D) The expression of p21 and p57 were analyzed by qPCR, and the expression of β-actin gene represented internal controls. Data represent the mean of at least three independent experiments ± SEM. *P < 0.05 vs. control MO.

EXPRESSION / LABELING:
Genes:
Fish:
Knockdown Reagent:
Anatomical Term:
Stage Range: 14-19 somites to Prim-5
PHENOTYPE:
Fish:
Knockdown Reagent:
Observed In:
Stage Range: 14-19 somites to Prim-5

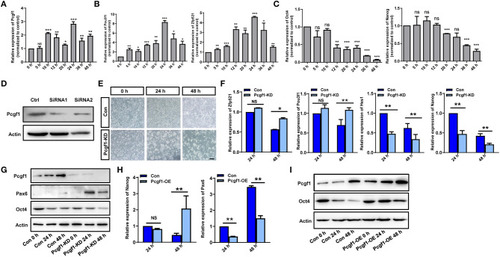
Pcgf1 had a positive role in maintaining the pluripotency of P19 cells. (A) qPCR showed that the expression of Pcgf1 was increased in P19 cells induced by retinoic acid, especially 24 h later. (B,C) The expression of neural markers Pou3f1 and Zfp521 were increased, while the pluripotent markers Oct4 and Nanog were decreased. (D) Construction of stable P19 cell line with Pcgf1 knockdown by lentivirus. (E) P19 cells clustered earlier than the control group after Pcgf1 knocked down at 24 and 48 h induced by RA. Scale bar, 100 μm. (F) The expression levels of the neural markers Pou3f1 and Zfp521, and the pluripotent markers Hes1 and Nanog, were detected by qPCR after Pcgf1 knock down at 2 and 48 h induced by RA. (G) The expression levels of the neural marker Pax6 and the pluripotent marker Oct4 were detected by Western blot after Pcgf1 knock down at 0, 24, and 48 h induced by RA. (H) The expression levels of the neural marker Pax6 and the pluripotent marker Nanog were detected by qPCR after overexpressed Pcgf1 at 24 and 48 h was induced by RA. (I) The Western blot results showed that pluripotent marker Oct4 was consistently expressed after overexpressed Pcgf1 at 0, 24, and 48 h was induced by RA. Data represent the mean of at least three independent experiments ± SEM. The expression of β-actin gene represented internal controls. *P < 0.05 vs. control, **P < 0.01 vs. control, ***P < 0.001 vs. control.

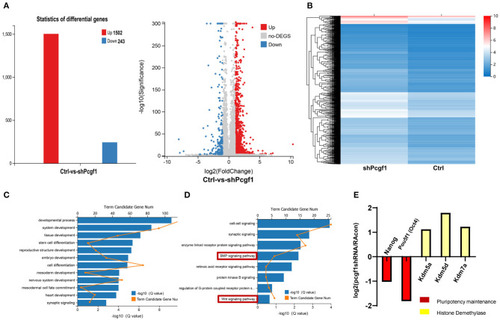
Pcgf1 regulated neural induction through an epigenetic mechanism in addition to signaling pathways. (A) Histogram and volcano plots represented differentially expressed genes in wild type and Pcgf1-KD P19 cells. The red color indicates upregulated genes, and the blue color indicates downregulated genes if they had a log2 fold change of >1 or < −1, respectively. The differentially expressed gene number was indicated at right. (B) A heat map of genes with more than 2-fold expression differences in wild-type and Pcgf1-KD P19 cells. Red indicates a high expression, and blue indicates a low expression. (C) Gene ontology (GO) analysis of biological functions of deregulated genes in Pcgf1-KD P19 cells. (D) GO analysis of signaling pathways of deregulated genes in Pcgf1-KD P19 cells. (E) Fold changes of the expression levels of pluripotent markers (nanog and pou5f1) and histone demethylase (kdm5a, kdm5d, and kdm7a) in RNA-seq results.

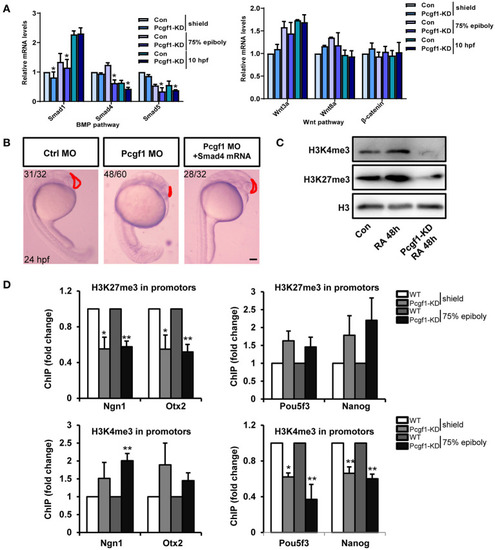
Pcgf1 regulated neural induction through histone methylation. (A) qPCR analysis of the expression levels of BMP signaling pathway (Smad1, Smad4, and Smad5) and Wnt signaling pathway (wnt3a, wnt8a, and β-catenin). Compared with the controls, the mRNA levels of Smad1, Smad4, and Smad5 in Pcgf1 MO-injected embryos decreased, but the levels of wnt3a, wnt8a, and β-catenin did not change observably. Data represent the mean of at least three independent experiments ± SD. *P < 0.05 vs. control. (B) Compared with the embryos injected with Pcgf1 MO, the shrinking of the telencephalon has not been rescued by the addition of Smad4 mRNA. (C) Western blot showed that the expression of H3K4me3 and H3K27me3 decreased after Pcgf1 knocked down. (D) The WT and Pcgf1 MO-injected group were immunoprecipitated with anti-H3K27me3, anti-H3K4me3, and IgG. The isolated DNA was analyzed by gene-specific ChIP primers. The levels of H3K27me3 at the promoters of Ngn1 and Otx2, and the levels of H3K4me3 at the promoters of Pou5f3 and Nanog, were significantly decreased after injection with the Pcgf1 MO. Data represent the mean of at least three independent experiments ± SD. *P < 0.05, **P < 0.01.

EXPRESSION / LABELING:
Genes:
Fish:
Knockdown Reagent:
Anatomical Term:
Stage Range: Shield to Bud

Schematic representation of the effect of Pcgf1 on the neural induction and NSC self-renewal.

Acknowledgments
This image is the copyrighted work of the attributed author or publisher, and ZFIN has permission only to display this image to its users. Additional permissions should be obtained from the applicable author or publisher of the image. Full text @ Front Cell Dev Biol