IMAGE

Figure 4

ID
ZDB-IMAGE-210216-35
Genes
Source
Figures for Li et al., 2021
Image
Figure Caption

Figure 4

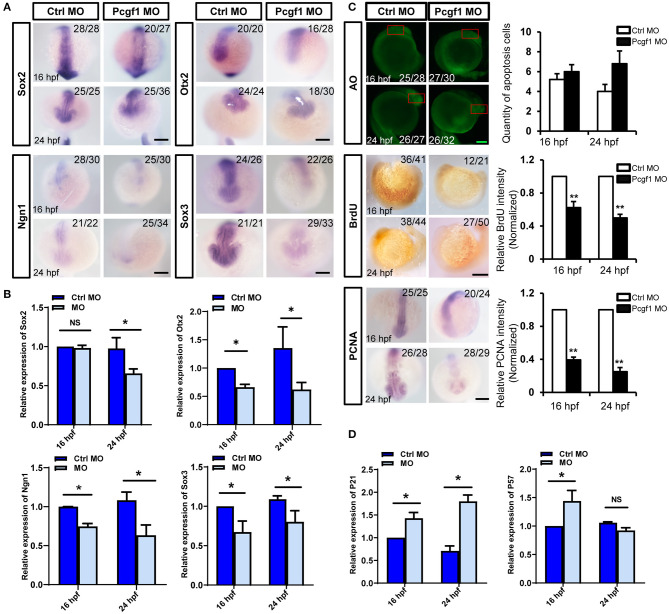
Effect of Pcgf1 on neural stem cells (NSCs) in neural tubes. (A) The expression levels of Sox2, Otx2, Ngn1, and Sox3 were detected by whole-mount in situ hybridization at self-renewal phase of NSCs (16 and 24 hpf). Scale bar: 200 μm. (B) The expression of Sox2, Otx2, Ngn1, and Sox3 was analyzed by qPCR, and the expression of β-actin gene represented internal controls. Data represent the mean of at least three independent experiments ± SEM, *P < 0.05 vs. control MO. (C) Acridine orange staining was used to detect apoptosis at 16 and 24 hpf; BrdU labeling of control MO and Pcgf1 MO-injected embryos at 16 and 24 hpf. The expression of PCNA was detected by whole-mount in situ hybridization. Data represent the mean of at least three independent experiments ± SEM, **P < 0.01 vs. control MO. (D) The expression of p21 and p57 were analyzed by qPCR, and the expression of β-actin gene represented internal controls. Data represent the mean of at least three independent experiments ± SEM. *P < 0.05 vs. control MO.

Figure Data
Acknowledgments
This image is the copyrighted work of the attributed author or publisher, and ZFIN has permission only to display this image to its users. Additional permissions should be obtained from the applicable author or publisher of the image. Full text @ Front Cell Dev Biol