
- Title
-
TDP-43 Regulation of AChE Expression Can Mediate ALS-Like Phenotype in Zebrafish
- Authors
- Campanari, M.L., Marian, A., Ciura, S., Kabashi, E.
- Source
- Full text @ Cells
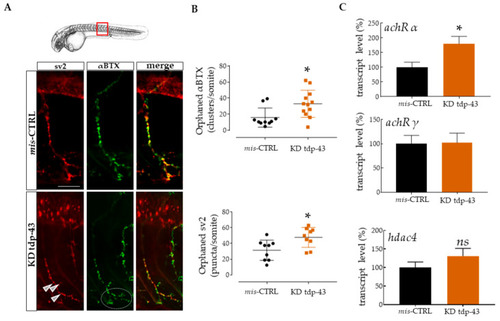
Knockdown (KD) of TAR DNA-binding protein 43 (tdp-43) caused motor impairments and defective neuromuscular junction (NMJ) structure. (A) Representative images of one ventral root projection double labeled for sv2 (presynaptic marker, red) and αBTX (postsynaptic, green). mis-CTRL embryos showed extensive red and green colocalization when converted in spots by Imaris software, as can be seen from the yellow staining seen in the merged images. Scale bar equals 10 μm. (B) Quantification of orphaned αBTX clusters for somite and of orphaned sv2 pre-synaptic marker. These clusters described as “spots” were measured following 3D reconstruction of the ventral CaP axon extension by Imaris [52]. Each point in these graphs represents the number of orphan spots per axon extension. Six fish were used for this study. (C) Relative transcript levels of ach receptors α and γ, and muscle histone deacetylase 4 (hdac4) expressed as a percentage and normalized to tubulin. Error bars represent standard error of the mean (SEM). * p < 0.05. ns = not significant. |
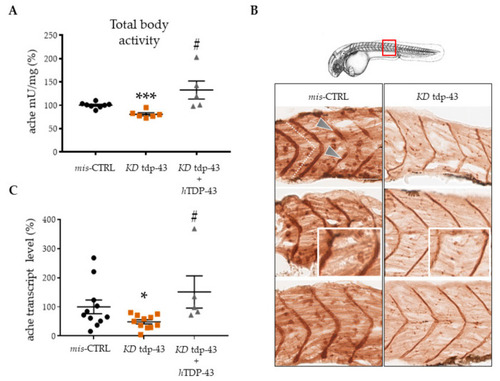
TDP-43 loss of function (LoF) caused decreased acetylcholinesterase (ache) expression. (A) Quantitation of ache activity by the spectrophotometric method of Ellman in extracts prepared from 48 hpf embryos. (B) ache activity revealed by Karnovsky and Roots staining in sagittal sections of mis-CTRL and tdp-43 KD embryos. Pictures represent the magnification of the 10th somite (red square). After tdp-43 KD, the intensity of immunostaining was weaker, with spots representing functional NMJ units appearing as smaller and diffuse. Scale bar equals 10 μm. (C) Messenger RNA levels of the ache transcript were measured by qPCR from zebrafish (zf) extracts. Values were expressed in percentage and normalized to gapdh. Error bars represent standard error of the mean (SEM). * p < 0.05 difference with control. *** p < 0.001 difference with control. # p < 0.05 difference between KD tdp-43′ and KD tdp-43+hTDP-43. |
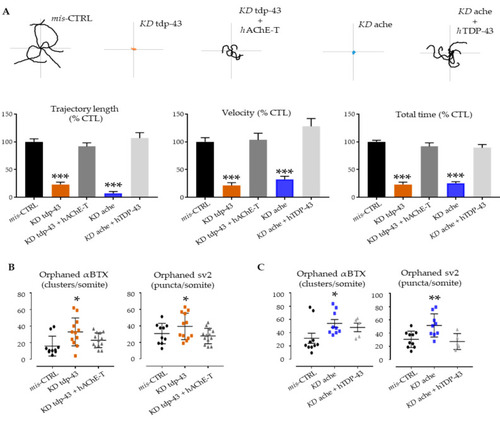
Genetic interactions between ache and tardbp. (A) Examples of locomotor path traces from single- and double-injected groups. tdp-43 rescued ache KD and human ACHE overexpression reduced phenotypic features observed upon tdp-43 KD. Column graph represents the quantification of motor parameters measured at the TEER test: trajectory length, swimming velocity, and total time. (B,C) At the NMJ level, the functional rescue was accompanied with amelioration of post- and pre-synaptic deficits. After injection with human TDP-43 and AChE-T, the KD phenotypes were ameliorated with a general decrease of orphan spots indicating amelioration in the formation of proper NMJ units. Error bars represent standard error of the mean (SEM). * p < 0.05, ** p < 0.01, *** p < 0.001 difference with control. PHENOTYPE:
|