
|
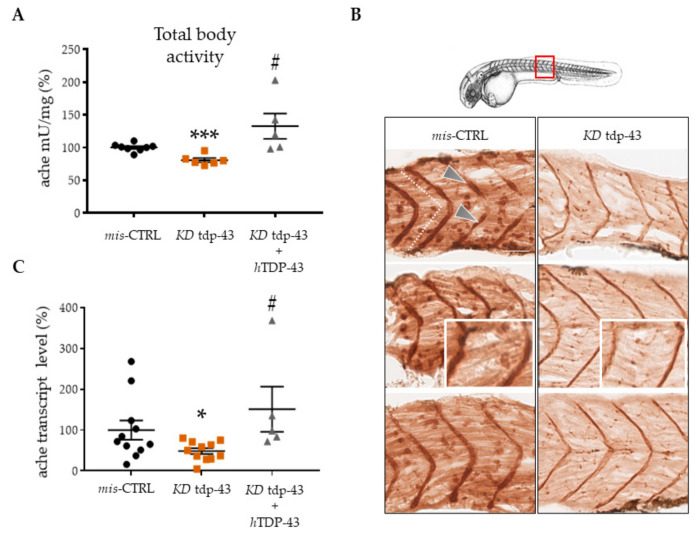
Figure 2 TDP-43 loss of function (LoF) caused decreased acetylcholinesterase (ache) expression. (A) Quantitation of ache activity by the spectrophotometric method of Ellman in extracts prepared from 48 hpf embryos. (B) ache activity revealed by Karnovsky and Roots staining in sagittal sections of mis-CTRL and tdp-43 KD embryos. Pictures represent the magnification of the 10th somite (red square). After tdp-43 KD, the intensity of immunostaining was weaker, with spots representing functional NMJ units appearing as smaller and diffuse. Scale bar equals 10 μm. (C) Messenger RNA levels of the ache transcript were measured by qPCR from zebrafish (zf) extracts. Values were expressed in percentage and normalized to gapdh. Error bars represent standard error of the mean (SEM). * p < 0.05 difference with control. *** p < 0.001 difference with control. # p < 0.05 difference between KD tdp-43′ and KD tdp-43+hTDP-43.