
- Title
-
Tet Proteins Regulate Neutrophil Granulation in Zebrafish through Demethylation of socs3b mRNA
- Authors
- Banks, K.M., Lan, Y., Evans, T.
- Source
- Full text @ Cell Rep.

Figure 1. Granulation Is Defective in tet3−/− and tet2/3DM Embryonic Neutrophils Representative images of neutrophil staining in wild-type, tet2−/−, tet3−/−, and tet2/3DM embryos at 3 dpf. (A–D) Caudal hematopoietic tissue (CHT) region following WISH to analyze mpx transcripts. (E–H) CHT region of embryos stained for Sudan black (SB). Scale bars in (A)–(H) represent 200 μm. (I–L) High-resolution images of SB-stained neutrophils. Scale bars represent 2 μm. (M and N) Quantification of total mpx+ (immature and mature neutrophils) and SB+ (mature neutrophils) cells in embryos at 2 dpf (M) and 3 dpf (N); n = 10/condition, ∗p < 0.05, ∗∗∗p < 0.001, ∗∗∗∗p < 0.0001 by 2-way ANOVA with Tukey post hoc test. |
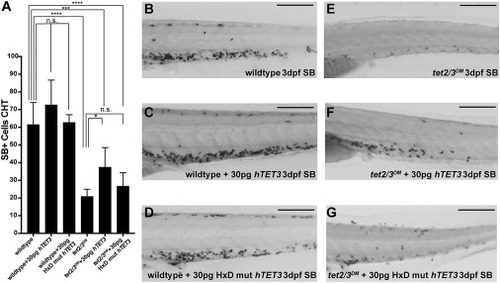
Figure 2. Human TET3 Overexpression Rescues the Granulation Defect in tet2/3DM Embryos (A) Quantification of SB+ cells in the CHT region for uninjected, 30 pg wild-type hTET3 and 30 pg catalytically dead mutant (HxD) hTET3-injected wild-type and tet2/3DM embryos at 3 dpf; n = 6/condition, ∗p < 0.05, ∗∗∗p < 0.001, ∗∗∗∗p < 0.0001 by 2-way ANOVA with Tukey post hoc test. (B–G) Representative images of the CHT of SB-stained uninjected, wild-type hTET3-injected, or mutant hTET3-injected wild-type and tet2/3DM embryos at 3 dpf. Scale bars represent 200 μm. |

Figure 3. Phagocytosis Defect Is Unique to tet2/3DM Embryonic Neutrophils (A–D) Representative images of the CHT region in pHrodo-red-injected 3-dpf wild-type, tet2−/−/, tet3−/−, and tet2/3DM mpx:GFP embryos. Scale bars represent 200 μm. (E) Quantification of phagocytosed beads by fluorescent area within GFP+ neutrophils in pixels squared. (F) Quantification of lysosome acidification by mean fluorescence intensity in arbitrary fluorescence units (A.F.U.). n = 5–7 embryos/condition, ∗∗p < 0.01, ∗∗∗∗p < 0.0001 by 2-way ANOVA with Tukey post hoc test of each condition compared to wild type. |
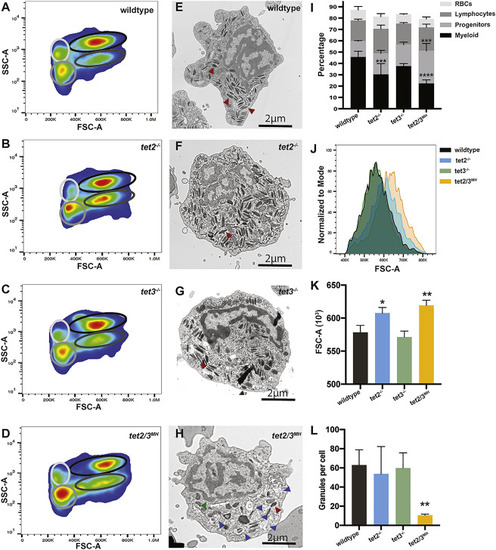
Figure 4. Granulation Defects Are Also Found in tet2/3MH Adult Neutrophils (A–D) Representative flow cytometry analysis of whole-kidney marrow (WKM) for 1-year-old wild-type, tet2−/−, tet3−/−, and tet2/3MH zebrafish. Myeloid cells are delineated by the black circle, hematopoietic progenitors by a dark gray circle, lymphocytes by a medium gray circle, and red blood cells (RBCs) by a light gray circle. (E–H) Representative electron microscopy images of wild-type, tet2−/−, tet3−/−, and tet2/3MH neutrophils isolated by FACS from kidneys of 1-year-old adult zebrafish. Red arrowheads indicate representative granules, blue arrowheads indicate autophagosomes, and the green arrowhead indicates nuclear envelope separation. (I) Quantification of the percentage of cells of each subtype: myeloid cells, progenitors, lymphocytes, and RBCs; n = 3/condition. (J) Histogram comparing FSC-A for the myeloid gate in each genotype for a representative sample. (K) Quantification of mean FSC-A for the myeloid gate in each genotype; n = 3/condition. (L) Quantification of granules per cell in electron microscopy images; n = 4/condition. ∗p < 0.05, ∗∗p < 0.01, ∗∗∗p < 0.001, ∗∗∗∗p < 0.0001 compared to wild type by one-way ANOVA with Tukey post hoc test. |

Figure 5. Transcriptional Profiling of tet Mutant Neutrophils Reveals Reduced Cytokine Response in tet3−/− and tet2/3DM Analysis of RNA sequencing from sorted neutrophils of 35-hpf wild-type, 2-dpf wild-type, 2-dpf tet2−/−, 2-dpf tet3−/−, and 2-dpf tet2/3DM embryos. (A) Principal component analysis for all samples, with three independent biological samples representing each genotype, as indicated by colored circles. (B) Enriched GO terms related to hematopoiesis in genes downregulated in 2-dpf tet2/3DM samples compared to 2-dpf wild-type samples. (C) Volcano plot comparing 2-dpf tet3−/− and wild-type samples; the top 20 dysregulated genes are labeled. (D) Top 10 hallmark GSEA terms downregulated comparing 2-dpf tet3−/− and wild-type samples; categories involved in cytokine response are highlighted in red. (E) Volcano plot comparing 2-dpf tet2/3DM and wild-type samples; the top 20 dysregulated genes are labeled. (F) Top 10 hallmark GSEA terms downregulated comparing 2-dpf tet2/3DM and wild-type samples; categories involved in cytokine response are highlighted in red. |

Figure 6. Socs3b mRNA Levels Are Increased in tet Mutant Neutrophils and Mutation of socs3b Rescues the Neutrophil Granulation Defect in tet2/3DM Embryos (A) Fragments per kilobase million (FPKM) for all SOCS family members across all genotypes; significance represents the adjusted p value from DESeq differential analysis comparing all other samples to wild type. ∗p-adj < 0.05, ∗∗p-adj < 0.01, ∗∗∗p-adj < 0.001, ∗∗∗∗p-adj < 0.0001. (B) Schematic of socs3b gene structure and CRISPR target site. (C) Representative T7 assay results demonstrating high gRNA targeting efficiency in 4 independent samples of F0 animals compared to wild-type uninjected embryos; 10 embryos per sample (WT). (D) Quantification of SB+ cells in the CHT region of uninjected embryos (black bars) and F0 socs3b CRISPR injected embryos (red bars) at 3 dpf; n = 4–9/condition, ∗p < 0.05, ∗∗p < 0.01 by 2-way ANOVA with Tukey post hoc test. (E and F) Representative images of SB staining in 2-dpf uninjected or socs3b mutated tet2/3DM embryos. Scale bars represent 500 μm. |

Figure 7. Socs3b mRNA Is Hypermethylated in tet2/3DM Neutrophils (A) RNA methylation status from RNA bisulfite-sequencing data for each CpG site in the socs3b locus for sorted wild-type or tet2/3DM 2-dpf neutrophils; n = 10/condition. Red triangles indicate cytosines mutated in the differentially methylated cytosine (DMC) mutant mRNA used in the following experiment. (B) Relative levels of socs3b mRNA at 1–4 dpf assessed by qRT-PCR that measures levels of the injected wild-type or DMC mutant transcripts; n = 6 groups of 5 embryos per data point, ∗p < 0.05 by 2-way ANOVA with Tukey post hoc test. (C) Minimum free energy RNA structure of socs3b. DMCs are highlighted by triangles. Red triangles represent bases that were mutated in generating the DMC mutant socs3b mRNA and black triangles represent unedited bases. Inset: a close-up of an RNA arm with several DMCs closely packed together indicated by the red box in the full structure. |